| Red | Green | Blue | |
| z | 17.64 | ||
| znorm | Inf | ||
| sky | -Inf | -Inf | -NaN |
| S/N | 28.1 | 48.9 | 55.2 |
| S/N(c) | 0.0 | 0.0 | 0.0 |
| SN(E/C) |
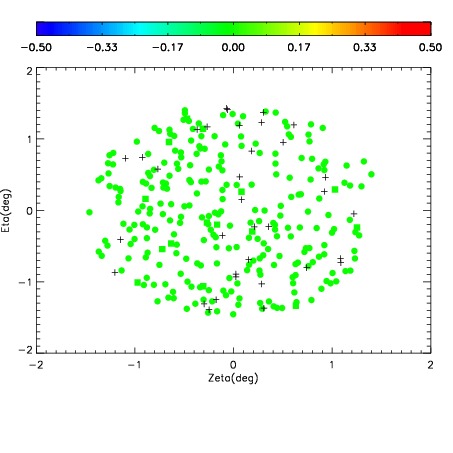
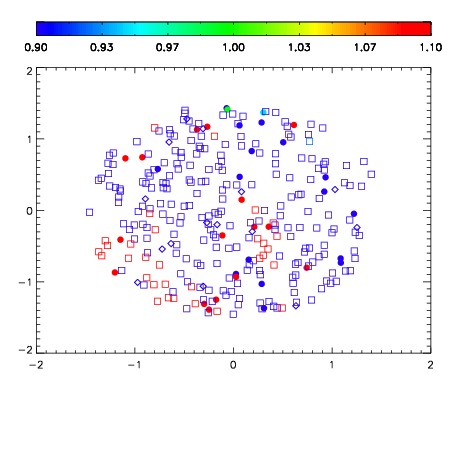
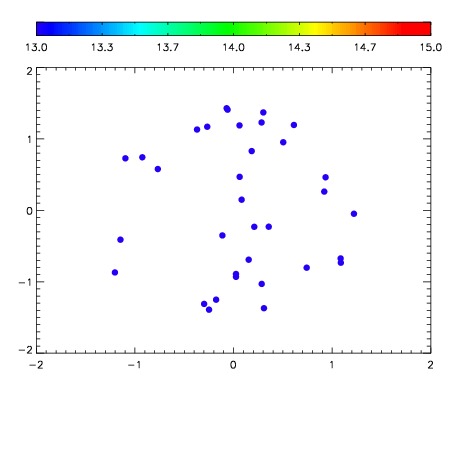

| Frame | Nreads | Zeropoints | Mag plots | Spatial mag deviation | Spatial sky 16325A emission deviations (filled: sky, open: star) | Spatial sky continuum emission | Spatial sky telluric CO2 absorption deviations (filled: H < 10) | |||||||||||||||||||||||
| 0 | 0 |
|
|
|
|
|
|
| IPAIR | NAME | SHIFT | NEWSHIFT | S/N | NAME | SHIFT | NEWSHIFT | S/N |
| 0 | 18130049 | 0.00141353 | 0.00000 | 19.1606 | 18130044 | -0.500780 | 0.502194 | 19.1671 |
| 1 | 18130046 | 0.000446766 | 0.000966764 | 19.1794 | 18130048 | -0.500914 | 0.502328 | 19.1716 |
| 2 | 18130045 | 0.000860534 | 0.000552996 | 19.1420 | 18130047 | -0.500554 | 0.501968 | 19.1550 |
| 3 | 18130042 | 0.00000 | 0.00141353 | 19.1285 | 18130043 | -0.500995 | 0.502409 | 19.1532 |