| Red | Green | Blue | |
| z | 17.64 | ||
| znorm | Inf | ||
| sky | -Inf | -Inf | -Inf |
| S/N | 22.3 | 40.7 | 44.4 |
| S/N(c) | 0.0 | 0.0 | 0.0 |
| SN(E/C) |
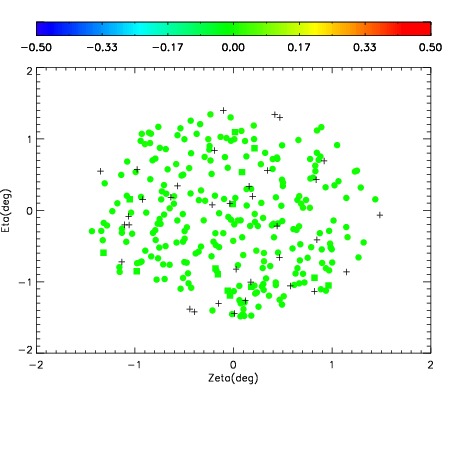
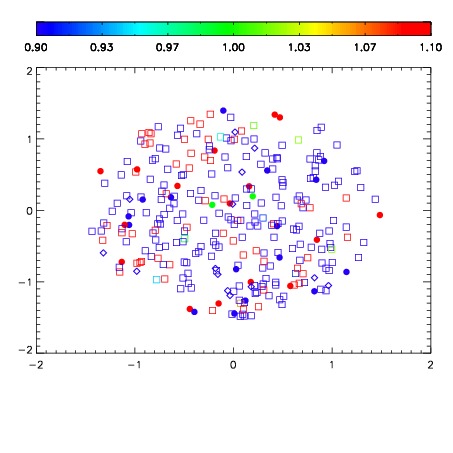
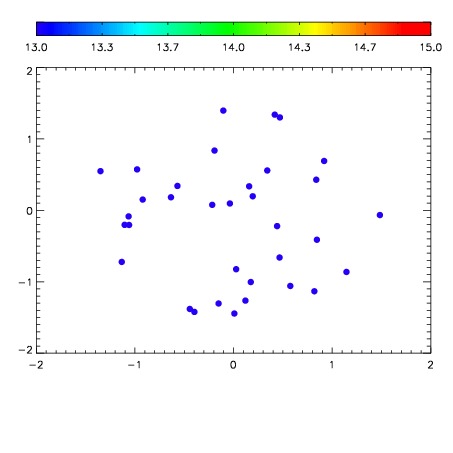

| Frame | Nreads | Zeropoints | Mag plots | Spatial mag deviation | Spatial sky 16325A emission deviations (filled: sky, open: star) | Spatial sky continuum emission | Spatial sky telluric CO2 absorption deviations (filled: H < 10) | |||||||||||||||||||||||
| 0 | 0 |
|
|
|
|
|
|
| IPAIR | NAME | SHIFT | NEWSHIFT | S/N | NAME | SHIFT | NEWSHIFT | S/N |
| 0 | 18120054 | 0.501490 | 0.00000 | 18.7791 | 18120055 | 0.00197430 | 0.499516 | 18.7783 |
| 1 | 18120053 | 0.500608 | 0.000881970 | 18.8945 | 18120052 | 0.00000 | 0.501490 | 18.8298 |
| 2 | 18120057 | 0.500203 | 0.00128698 | 18.7383 | 18120056 | 0.00198333 | 0.499507 | 18.7463 |
| 3 | 18120058 | 0.500859 | 0.000630975 | 18.6810 | 18120059 | 0.00460903 | 0.496881 | 18.7246 |