| Red | Green | Blue | |
| z | 17.64 | ||
| znorm | Inf | ||
| sky | -Inf | -Inf | -Inf |
| S/N | 21.7 | 38.1 | 42.5 |
| S/N(c) | 0.0 | 0.0 | 0.0 |
| SN(E/C) |
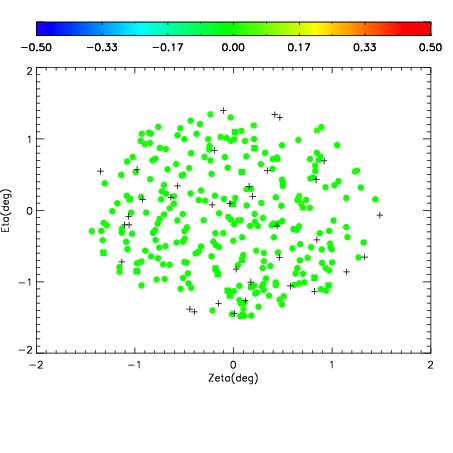
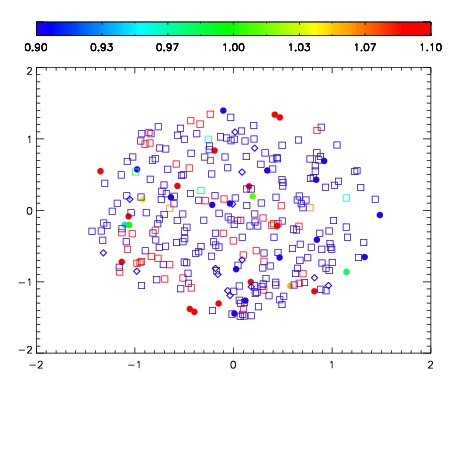
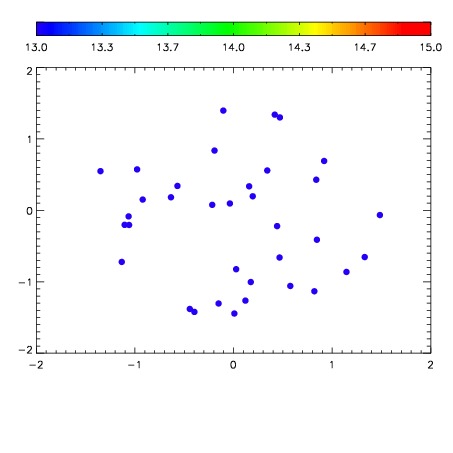

| Frame | Nreads | Zeropoints | Mag plots | Spatial mag deviation | Spatial sky 16325A emission deviations (filled: sky, open: star) | Spatial sky continuum emission | Spatial sky telluric CO2 absorption deviations (filled: H < 10) | |||||||||||||||||||||||
| 0 | 0 |
|
|
|
|
|
|
| IPAIR | NAME | SHIFT | NEWSHIFT | S/N | NAME | SHIFT | NEWSHIFT | S/N |
| 0 | 18160036 | 0.00000 | 0.00000 | 17.7059 | 18160045 | -0.502111 | 0.502111 | 18.3200 |
| 1 | 18160039 | -0.00419101 | 0.00419101 | 18.9478 | 18160038 | -0.501149 | 0.501149 | 18.9225 |
| 2 | 18160040 | -0.00324383 | 0.00324383 | 18.7213 | 18160041 | -0.502129 | 0.502129 | 18.8872 |
| 3 | 18160043 | -0.00320196 | 0.00320196 | 18.3711 | 18160042 | -0.502878 | 0.502878 | 18.6640 |
| 4 | 18160044 | -0.00204367 | 0.00204367 | 18.1855 | 18160037 | -0.501221 | 0.501221 | 18.5249 |
| 5 | 18160047 | -0.00108761 | 0.00108761 | 17.6223 | 18160046 | -0.502380 | 0.502380 | 18.1452 |