| Red | Green | Blue | |
| z | 17.64 | ||
| znorm | Inf | ||
| sky | -Inf | -Inf | -Inf |
| S/N | 12.8 | 24.6 | 27.7 |
| S/N(c) | 0.0 | 0.0 | 0.0 |
| SN(E/C) |
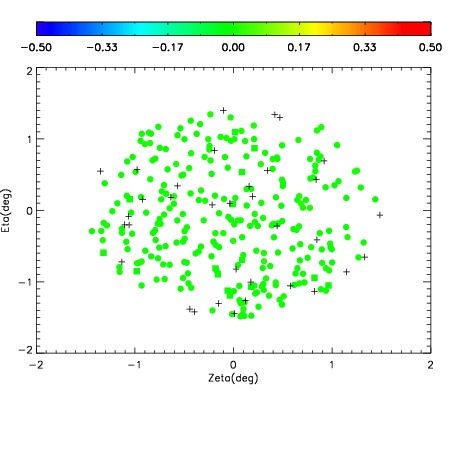
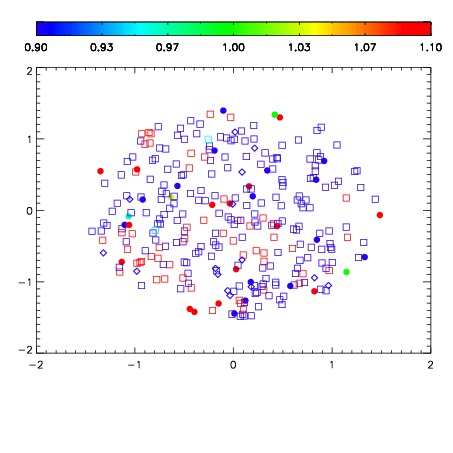
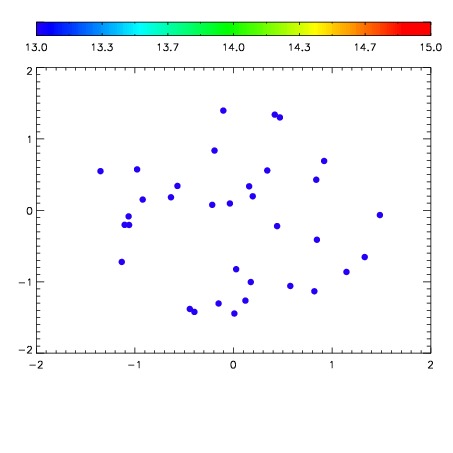

| Frame | Nreads | Zeropoints | Mag plots | Spatial mag deviation | Spatial sky 16325A emission deviations (filled: sky, open: star) | Spatial sky continuum emission | Spatial sky telluric CO2 absorption deviations (filled: H < 10) | |||||||||||||||||||||||
| 0 | 0 |
|
|
|
|
|
|
| IPAIR | NAME | SHIFT | NEWSHIFT | S/N | NAME | SHIFT | NEWSHIFT | S/N |
| 0 | 18420032 | 0.501853 | 0.00000 | 17.9140 | 18420033 | 0.00583395 | 0.496019 | 17.9236 |
| 1 | 18420028 | 0.499784 | 0.00206900 | 18.1139 | 18420026 | 0.00000 | 0.501853 | 18.4826 |
| 2 | 18420027 | 0.498662 | 0.00319099 | 18.1058 | 18420029 | 0.00215622 | 0.499697 | 18.0999 |
| 3 | 18420031 | 0.501547 | 0.000306010 | 17.8296 | 18420030 | 0.00305905 | 0.498794 | 17.8990 |