| Red | Green | Blue | |
| z | 17.64 | ||
| znorm | Inf | ||
| sky | -Inf | -Inf | -NaN |
| S/N | 24.6 | 43.7 | 47.6 |
| S/N(c) | 0.0 | 0.0 | 0.0 |
| SN(E/C) |
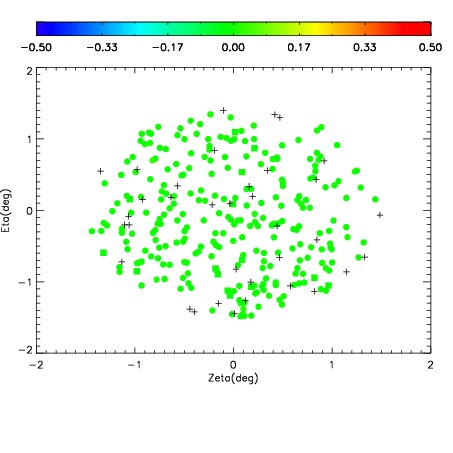
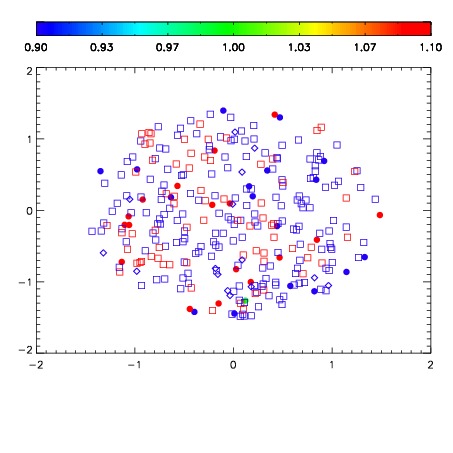
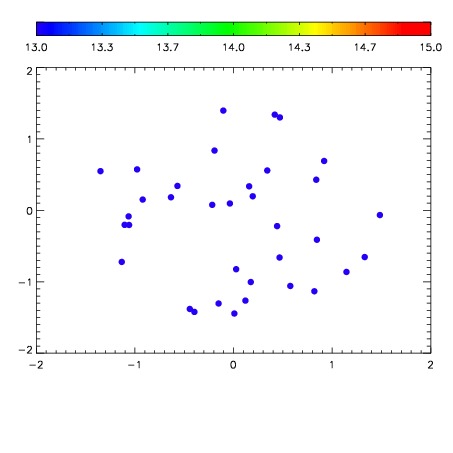

| Frame | Nreads | Zeropoints | Mag plots | Spatial mag deviation | Spatial sky 16325A emission deviations (filled: sky, open: star) | Spatial sky continuum emission | Spatial sky telluric CO2 absorption deviations (filled: H < 10) | |||||||||||||||||||||||
| 0 | 0 |
|
|
|
|
|
|
| IPAIR | NAME | SHIFT | NEWSHIFT | S/N | NAME | SHIFT | NEWSHIFT | S/N |
| 0 | 18450035 | 0.499987 | 0.00000 | 18.8888 | 18450032 | 0.00367356 | 0.496313 | 18.8351 |
| 1 | 18450030 | 0.499771 | 0.000216007 | 18.9802 | 18450029 | 0.00000 | 0.499987 | 18.9382 |
| 2 | 18450031 | 0.499777 | 0.000210017 | 18.9181 | 18450036 | 0.00279598 | 0.497191 | 18.9255 |
| 3 | 18450034 | 0.499577 | 0.000410020 | 18.8799 | 18450033 | 0.00400347 | 0.495984 | 18.8137 |