| Red | Green | Blue | |
| z | 17.64 | ||
| znorm | Inf | ||
| sky | -Inf | -Inf | -NaN |
| S/N | 28.7 | 49.1 | 57.7 |
| S/N(c) | 0.0 | 0.0 | 0.0 |
| SN(E/C) |
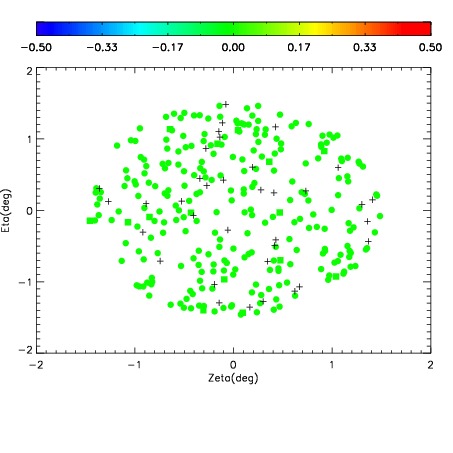
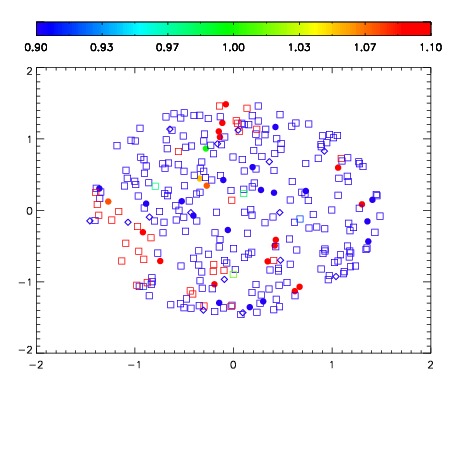
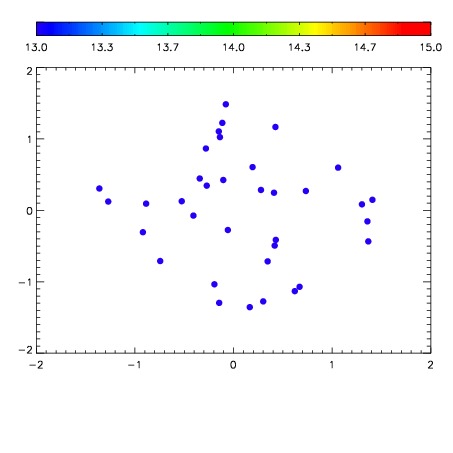

| Frame | Nreads | Zeropoints | Mag plots | Spatial mag deviation | Spatial sky 16325A emission deviations (filled: sky, open: star) | Spatial sky continuum emission | Spatial sky telluric CO2 absorption deviations (filled: H < 10) | |||||||||||||||||||||||
| 0 | 0 |
|
|
|
|
|
|
| IPAIR | NAME | SHIFT | NEWSHIFT | S/N | NAME | SHIFT | NEWSHIFT | S/N |
| 0 | 18120047 | 0.507075 | 0.00000 | 18.5180 | 18120044 | 0.00633625 | 0.500739 | 18.6752 |
| 1 | 18120042 | 0.505241 | 0.00183403 | 18.8837 | 18120040 | 0.00419805 | 0.502877 | 18.8991 |
| 2 | 18120039 | 0.505706 | 0.00136900 | 18.8424 | 18120041 | 0.00442589 | 0.502649 | 18.8840 |
| 3 | 18120038 | 0.505286 | 0.00178903 | 18.8022 | 18120037 | 0.00000 | 0.507075 | 18.8143 |
| 4 | 18120043 | 0.506023 | 0.00105202 | 18.7201 | 18120045 | 0.00559999 | 0.501475 | 18.7354 |
| 5 | 18120046 | 0.506194 | 0.000881016 | 18.5283 | 18120048 | 0.00588325 | 0.501192 | 18.7314 |