| Red | Green | Blue | |
| z | 17.64 | ||
| znorm | Inf | ||
| sky | -Inf | -Inf | -NaN |
| S/N | 24.6 | 44.7 | 49.8 |
| S/N(c) | 0.0 | 0.0 | 0.0 |
| SN(E/C) |

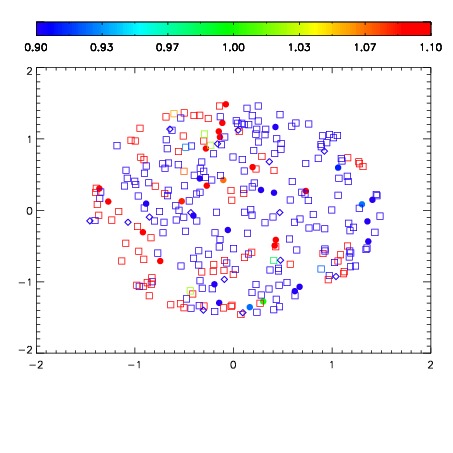
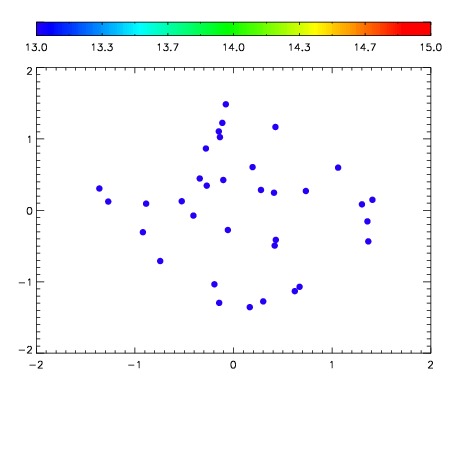

| Frame | Nreads | Zeropoints | Mag plots | Spatial mag deviation | Spatial sky 16325A emission deviations (filled: sky, open: star) | Spatial sky continuum emission | Spatial sky telluric CO2 absorption deviations (filled: H < 10) | |||||||||||||||||||||||
| 0 | 0 |
|
|
|
|
|
|
| IPAIR | NAME | SHIFT | NEWSHIFT | S/N | NAME | SHIFT | NEWSHIFT | S/N |
| 0 | 18150024 | 0.502495 | 0.00000 | 18.6580 | 18150025 | 0.00284340 | 0.499652 | 18.6620 |
| 1 | 18150028 | 0.502107 | 0.000387967 | 18.9094 | 18150026 | 0.00252256 | 0.499972 | 18.8970 |
| 2 | 18150027 | 0.501794 | 0.000701010 | 18.8291 | 18150029 | 0.00245409 | 0.500041 | 18.8838 |
| 3 | 18150031 | 0.501286 | 0.00120902 | 18.8277 | 18150030 | 0.00241383 | 0.500081 | 18.8187 |
| 4 | 18150023 | 0.501948 | 0.000546992 | 18.7422 | 18150022 | 0.00000 | 0.502495 | 18.6639 |