| Red | Green | Blue | |
| z | 17.64 | ||
| znorm | Inf | ||
| sky | -Inf | -Inf | -Inf |
| S/N | 20.9 | 36.8 | 41.8 |
| S/N(c) | 0.0 | 0.0 | 0.0 |
| SN(E/C) |
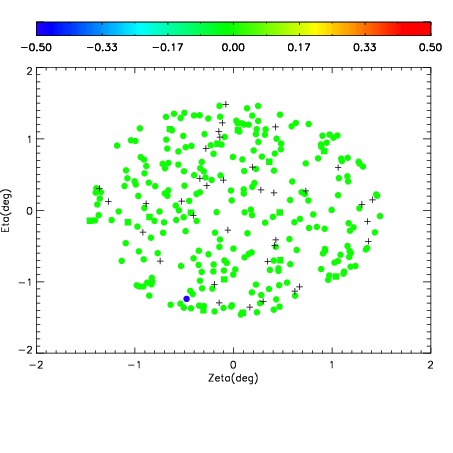
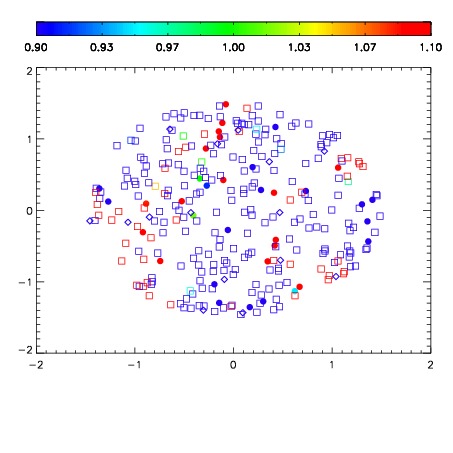
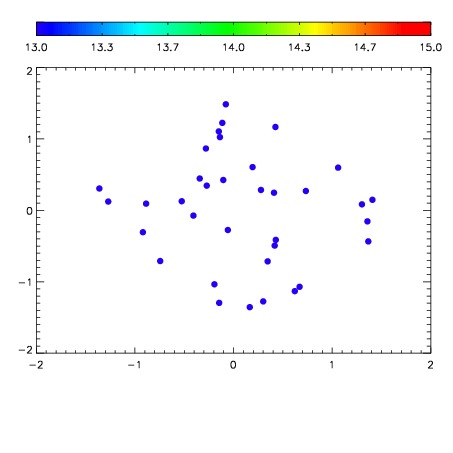

| Frame | Nreads | Zeropoints | Mag plots | Spatial mag deviation | Spatial sky 16325A emission deviations (filled: sky, open: star) | Spatial sky continuum emission | Spatial sky telluric CO2 absorption deviations (filled: H < 10) | |||||||||||||||||||||||
| 0 | 0 |
|
|
|
|
|
|
| IPAIR | NAME | SHIFT | NEWSHIFT | S/N | NAME | SHIFT | NEWSHIFT | S/N |
| 0 | 18430017 | 0.505885 | 0.00000 | 18.7174 | 18430015 | 0.00304667 | 0.502838 | 18.8059 |
| 1 | 18430013 | 0.503830 | 0.00205499 | 18.5628 | 18430018 | 0.00304667 | 0.502838 | 18.7521 |
| 2 | 18430012 | 0.503892 | 0.00199300 | 18.5513 | 18430014 | 0.00247852 | 0.503406 | 18.5858 |
| 3 | 18430016 | 0.505424 | 0.000460982 | 18.4335 | 18430011 | 0.00000 | 0.505885 | 18.5638 |