| Red | Green | Blue | |
| z | 17.64 | ||
| znorm | Inf | ||
| sky | -Inf | -NaN | -NaN |
| S/N | 29.5 | 49.9 | 57.6 |
| S/N(c) | 0.0 | 0.0 | 0.0 |
| SN(E/C) |
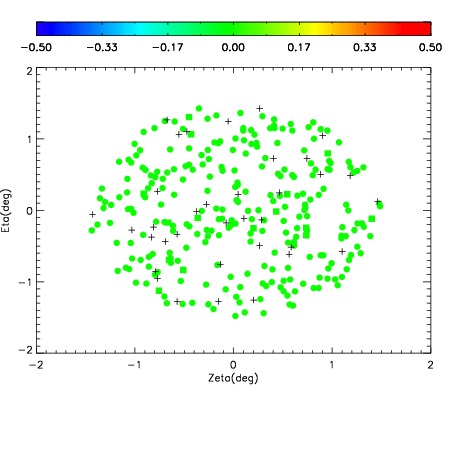
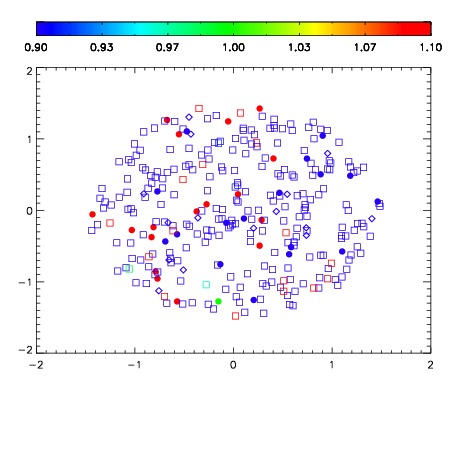
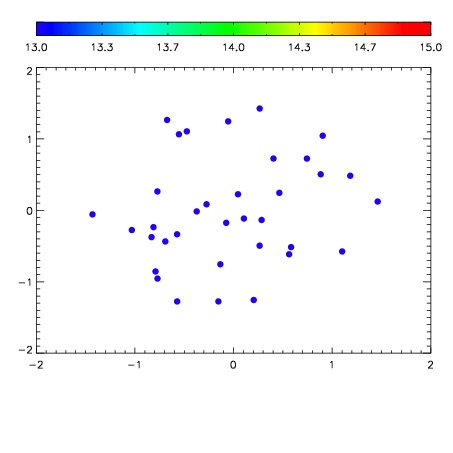

| Frame | Nreads | Zeropoints | Mag plots | Spatial mag deviation | Spatial sky 16325A emission deviations (filled: sky, open: star) | Spatial sky continuum emission | Spatial sky telluric CO2 absorption deviations (filled: H < 10) | |||||||||||||||||||||||
| 0 | 0 |
|
|
|
|
|
|
| IPAIR | NAME | SHIFT | NEWSHIFT | S/N | NAME | SHIFT | NEWSHIFT | S/N |
| 0 | 18130060 | 0.00109663 | 0.00000 | 19.1833 | 18130059 | -0.502007 | 0.503104 | 19.1506 |
| 1 | 18130057 | -0.000857937 | 0.00195457 | 19.0887 | 18130058 | -0.503376 | 0.504473 | 19.1118 |
| 2 | 18130056 | -0.000661720 | 0.00175835 | 19.0837 | 18130054 | -0.503684 | 0.504781 | 19.1070 |
| 3 | 18130053 | 0.00000 | 0.00109663 | 19.0700 | 18130055 | -0.504180 | 0.505277 | 19.0926 |