| Red | Green | Blue | |
| z | 17.64 | ||
| znorm | Inf | ||
| sky | -NaN | -Inf | -NaN |
| S/N | 24.5 | 43.3 | 48.6 |
| S/N(c) | 0.0 | 0.0 | 0.0 |
| SN(E/C) |
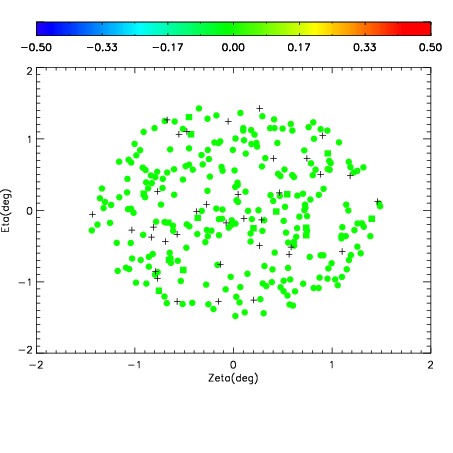
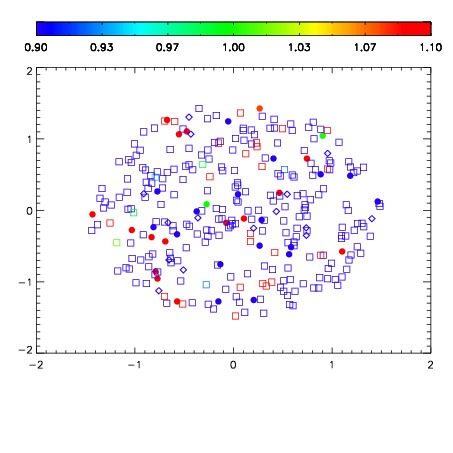
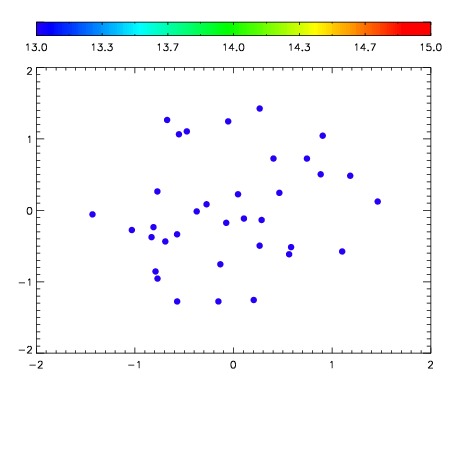

| Frame | Nreads | Zeropoints | Mag plots | Spatial mag deviation | Spatial sky 16325A emission deviations (filled: sky, open: star) | Spatial sky continuum emission | Spatial sky telluric CO2 absorption deviations (filled: H < 10) | |||||||||||||||||||||||
| 0 | 0 |
|
|
|
|
|
|
| IPAIR | NAME | SHIFT | NEWSHIFT | S/N | NAME | SHIFT | NEWSHIFT | S/N |
| 0 | 18430034 | 0.503672 | 0.00000 | 18.7294 | 18430033 | 0.00000 | 0.503672 | 18.7393 |
| 1 | 18430039 | 0.503638 | 3.39746e-05 | 18.9521 | 18430037 | 0.00236736 | 0.501305 | 18.9326 |
| 2 | 18430038 | 0.502633 | 0.00103903 | 18.9262 | 18430040 | 0.000340505 | 0.503331 | 18.9092 |
| 3 | 18430035 | 0.503329 | 0.000343025 | 18.7988 | 18430036 | 0.00268935 | 0.500983 | 18.8648 |