| Red | Green | Blue | |
| z | 17.64 | ||
| znorm | Inf | ||
| sky | -NaN | -Inf | -NaN |
| S/N | 18.0 | 35.6 | 39.9 |
| S/N(c) | 0.0 | 0.0 | 0.0 |
| SN(E/C) |
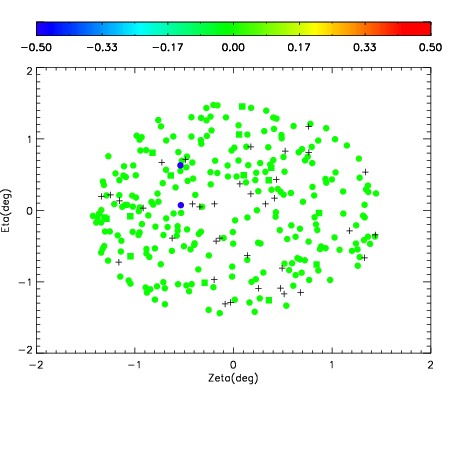

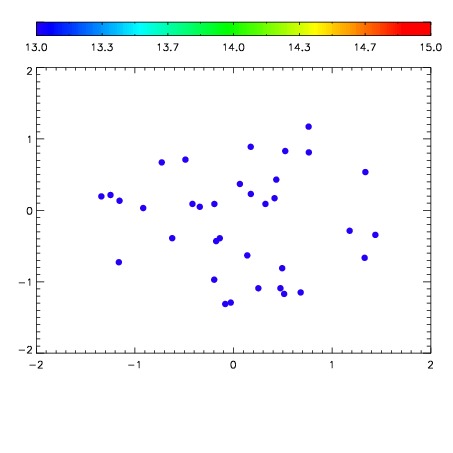

| Frame | Nreads | Zeropoints | Mag plots | Spatial mag deviation | Spatial sky 16325A emission deviations (filled: sky, open: star) | Spatial sky continuum emission | Spatial sky telluric CO2 absorption deviations (filled: H < 10) | |||||||||||||||||||||||
| 0 | 0 |
|
|
|
|
|
|
| IPAIR | NAME | SHIFT | NEWSHIFT | S/N | NAME | SHIFT | NEWSHIFT | S/N |
| 0 | 18160065 | 0.00154101 | 0.00000 | 18.7239 | 18160068 | -0.499749 | 0.501290 | 18.8767 |
| 1 | 18160062 | 0.00000 | 0.00154101 | 18.7077 | 18160063 | -0.499324 | 0.500865 | 18.8105 |
| 2 | 18160066 | 0.00140253 | 0.000138480 | 18.6828 | 18160064 | -0.499008 | 0.500549 | 18.8084 |
| 3 | 18160069 | 0.000910522 | 0.000630488 | 18.2096 | 18160067 | -0.499666 | 0.501207 | 18.6974 |