| Red | Green | Blue | |
| z | 17.64 | ||
| znorm | Inf | ||
| sky | -Inf | -Inf | -Inf |
| S/N | 30.5 | 52.8 | 61.2 |
| S/N(c) | 0.0 | 0.0 | 0.0 |
| SN(E/C) |
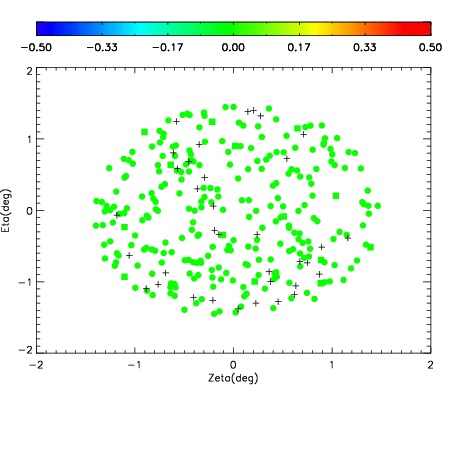
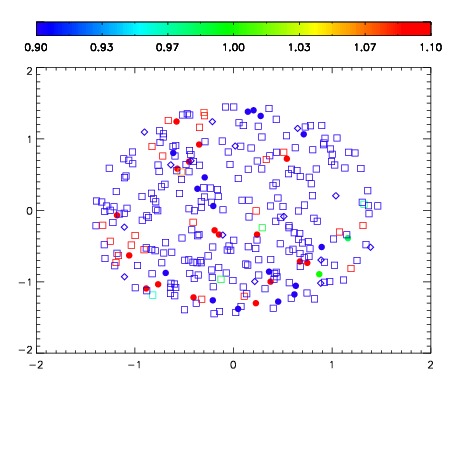
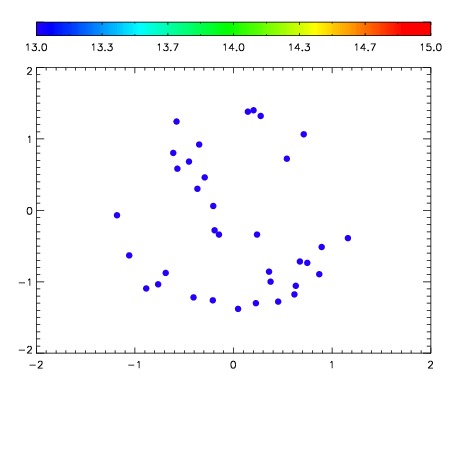

| Frame | Nreads | Zeropoints | Mag plots | Spatial mag deviation | Spatial sky 16325A emission deviations (filled: sky, open: star) | Spatial sky continuum emission | Spatial sky telluric CO2 absorption deviations (filled: H < 10) | |||||||||||||||||||||||
| 0 | 0 |
|
|
|
|
|
|
| IPAIR | NAME | SHIFT | NEWSHIFT | S/N | NAME | SHIFT | NEWSHIFT | S/N |
| 0 | 18430046 | 0.503718 | 0.00000 | 18.9988 | 18430048 | 0.00571385 | 0.498004 | 19.0106 |
| 1 | 18430050 | 0.502892 | 0.000826001 | 19.0413 | 18430051 | 0.00250907 | 0.501209 | 19.0612 |
| 2 | 18430049 | 0.501297 | 0.00242102 | 19.0267 | 18430047 | 0.00668306 | 0.497035 | 19.0220 |
| 3 | 18430045 | 0.502549 | 0.00116903 | 19.0137 | 18430044 | 0.00000 | 0.503718 | 19.0115 |
| 4 | 18430053 | 0.503373 | 0.000344992 | 18.9329 | 18430052 | 0.00215594 | 0.501562 | 18.9783 |