| Red | Green | Blue | |
| z | 17.64 | ||
| znorm | Inf | ||
| sky | -NaN | -NaN | -Inf |
| S/N | 17.9 | 30.7 | 34.5 |
| S/N(c) | 0.0 | 0.0 | 0.0 |
| SN(E/C) |
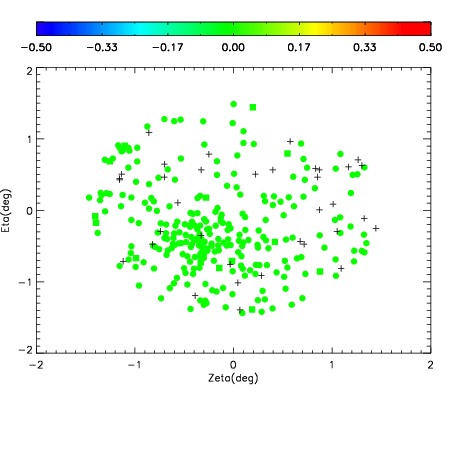
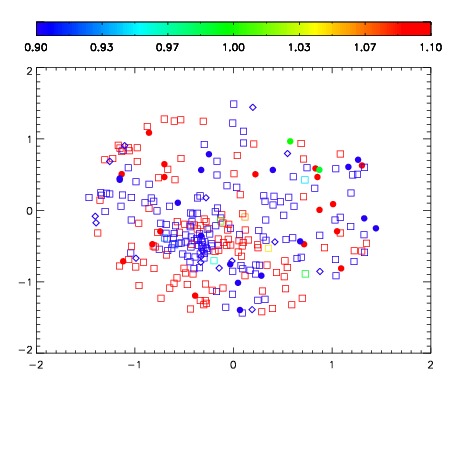
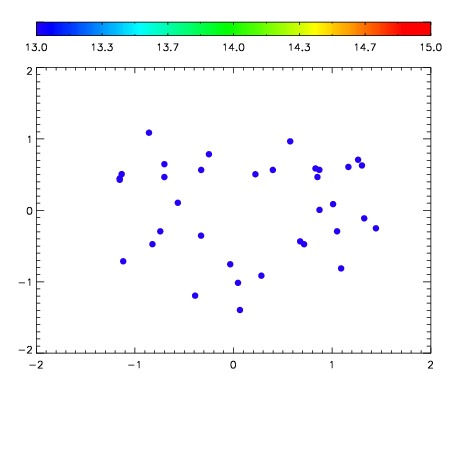

| Frame | Nreads | Zeropoints | Mag plots | Spatial mag deviation | Spatial sky 16325A emission deviations (filled: sky, open: star) | Spatial sky continuum emission | Spatial sky telluric CO2 absorption deviations (filled: H < 10) | |||||||||||||||||||||||
| 0 | 0 |
|
|
|
|
|
|
| IPAIR | NAME | SHIFT | NEWSHIFT | S/N | NAME | SHIFT | NEWSHIFT | S/N |
| 0 | 18440028 | 0.00576217 | 0.00000 | 18.2748 | 18440026 | -0.499158 | 0.504920 | 18.3222 |
| 1 | 18440027 | 0.00515996 | 0.000602210 | 18.5380 | 18440029 | -0.499280 | 0.505042 | 18.8495 |
| 2 | 18440023 | 0.00273554 | 0.00302663 | 18.3539 | 18440022 | -0.502826 | 0.508588 | 18.3563 |
| 3 | 18440020 | 0.00000 | 0.00576217 | 18.0284 | 18440021 | -0.503432 | 0.509194 | 18.2745 |
| 4 | 18440024 | 0.00338865 | 0.00237352 | 17.8479 | 18440025 | -0.499391 | 0.505153 | 17.5167 |