| Red | Green | Blue | |
| z | 17.64 | ||
| znorm | Inf | ||
| sky | -Inf | -Inf | -NaN |
| S/N | 26.9 | 43.4 | 48.5 |
| S/N(c) | 0.0 | 0.0 | 0.0 |
| SN(E/C) |
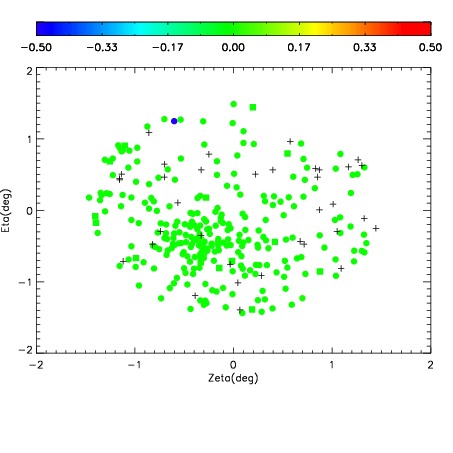
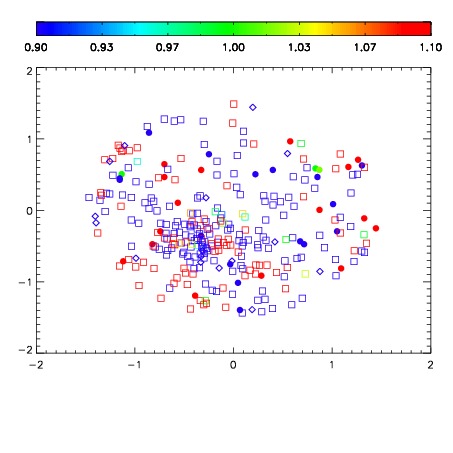
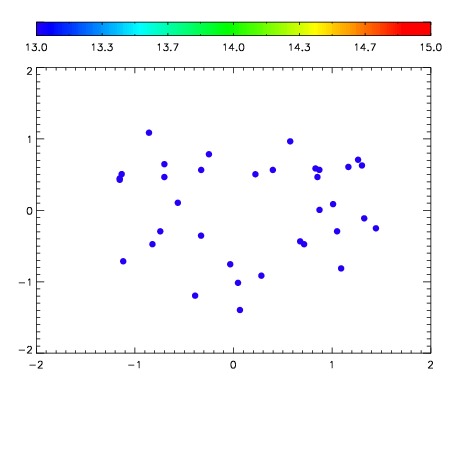

| Frame | Nreads | Zeropoints | Mag plots | Spatial mag deviation | Spatial sky 16325A emission deviations (filled: sky, open: star) | Spatial sky continuum emission | Spatial sky telluric CO2 absorption deviations (filled: H < 10) | |||||||||||||||||||||||
| 0 | 0 |
|
|
|
|
|
|
| IPAIR | NAME | SHIFT | NEWSHIFT | S/N | NAME | SHIFT | NEWSHIFT | S/N |
| 0 | 18490019 | 0.505074 | 0.00000 | 18.9984 | 18490020 | 0.00335705 | 0.501717 | 18.9871 |
| 1 | 18490015 | 0.504068 | 0.00100601 | 19.0395 | 18490017 | 0.00220237 | 0.502872 | 19.0883 |
| 2 | 18490018 | 0.504587 | 0.000487030 | 19.0341 | 18490016 | 0.00199144 | 0.503083 | 19.0459 |
| 3 | 18490014 | 0.503614 | 0.00146002 | 18.9587 | 18490013 | 0.00000 | 0.505074 | 18.9558 |