| Red | Green | Blue | |
| z | 17.64 | ||
| znorm | Inf | ||
| sky | -Inf | -NaN | -NaN |
| S/N | 19.2 | 31.5 | 37.2 |
| S/N(c) | 0.0 | 0.0 | 0.0 |
| SN(E/C) |
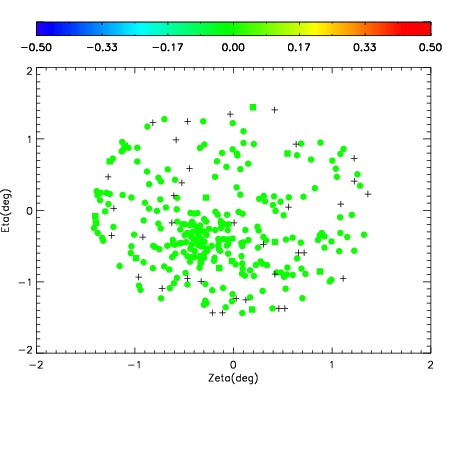
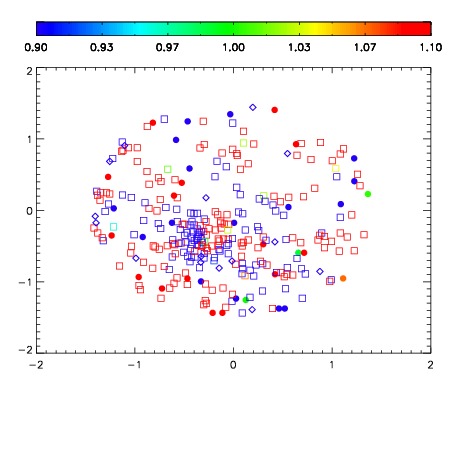
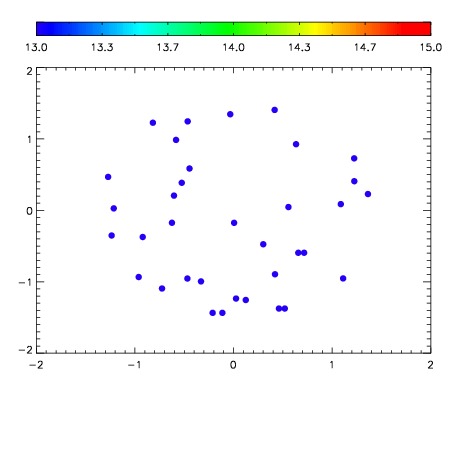

| Frame | Nreads | Zeropoints | Mag plots | Spatial mag deviation | Spatial sky 16325A emission deviations (filled: sky, open: star) | Spatial sky continuum emission | Spatial sky telluric CO2 absorption deviations (filled: H < 10) | |||||||||||||||||||||||
| 0 | 0 |
|
|
|
|
|
|
| IPAIR | NAME | SHIFT | NEWSHIFT | S/N | NAME | SHIFT | NEWSHIFT | S/N |
| 0 | 18510017 | 0.510706 | 0.00000 | 18.0930 | 18510015 | 0.00378740 | 0.506919 | 17.8285 |
| 1 | 18510013 | 0.507421 | 0.00328499 | 18.6159 | 18510014 | 0.00284312 | 0.507863 | 18.6515 |
| 2 | 18510016 | 0.509114 | 0.00159198 | 18.5824 | 18510011 | 0.00000 | 0.510706 | 18.4541 |
| 3 | 18510012 | 0.506411 | 0.00429499 | 18.4705 | 18510018 | 0.00372748 | 0.506979 | 17.9448 |
| 4 | 18510020 | 0.510613 | 9.29832e-05 | 17.7246 | 18510019 | 0.00413235 | 0.506574 | 17.4749 |