| Red | Green | Blue | |
| z | 17.64 | ||
| znorm | Inf | ||
| sky | -NaN | -NaN | -NaN |
| S/N | 31.4 | 50.7 | 53.9 |
| S/N(c) | 0.0 | 0.0 | 0.0 |
| SN(E/C) |
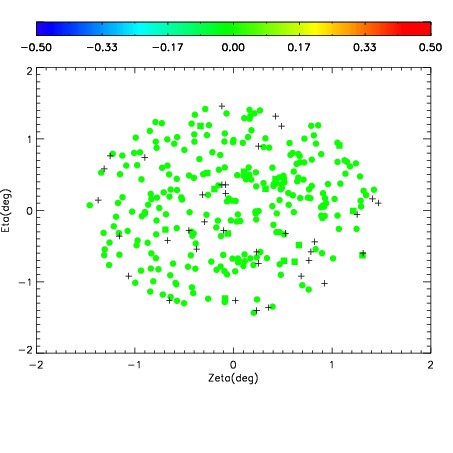
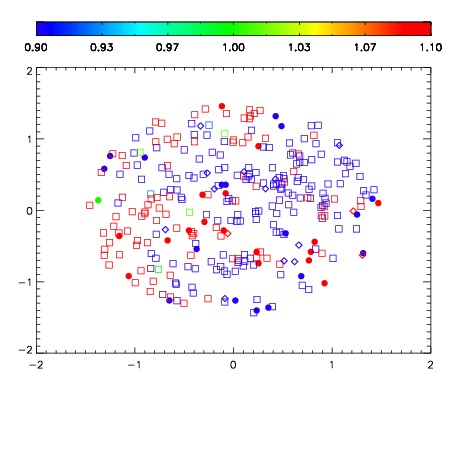
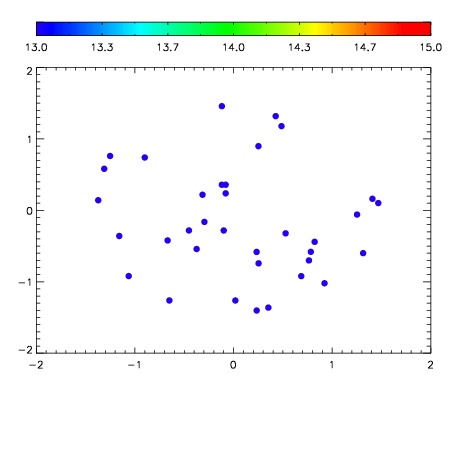

| Frame | Nreads | Zeropoints | Mag plots | Spatial mag deviation | Spatial sky 16325A emission deviations (filled: sky, open: star) | Spatial sky continuum emission | Spatial sky telluric CO2 absorption deviations (filled: H < 10) | |||||||||||||||||||||||
| 0 | 0 |
|
|
|
|
|
|
| IPAIR | NAME | SHIFT | NEWSHIFT | S/N | NAME | SHIFT | NEWSHIFT | S/N |
| 0 | 18470028 | 0.506791 | 0.00000 | 19.0106 | 18470025 | 0.00495078 | 0.501840 | 19.0269 |
| 1 | 18470027 | 0.505539 | 0.00125200 | 19.0321 | 18470029 | 0.00708290 | 0.499708 | 19.0640 |
| 2 | 18470024 | 0.504982 | 0.00180900 | 19.0252 | 18470026 | 0.00524543 | 0.501546 | 19.0608 |
| 3 | 18470023 | 0.504666 | 0.00212502 | 18.9989 | 18470022 | 0.00000 | 0.506791 | 18.9852 |