| Red | Green | Blue | |
| z | 17.64 | ||
| znorm | Inf | ||
| sky | -Inf | -Inf | -Inf |
| S/N | 16.8 | 29.1 | 32.0 |
| S/N(c) | 0.0 | 0.0 | 0.0 |
| SN(E/C) |
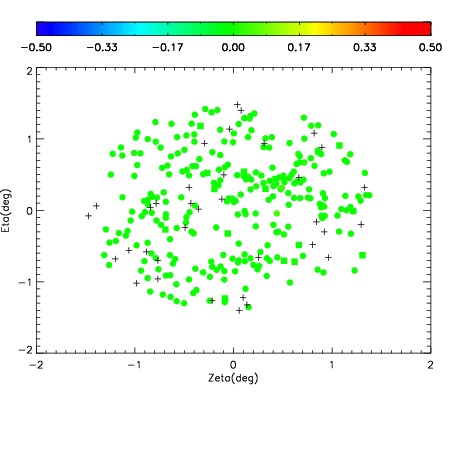
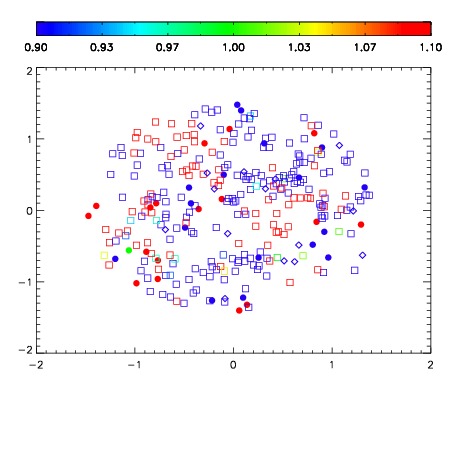
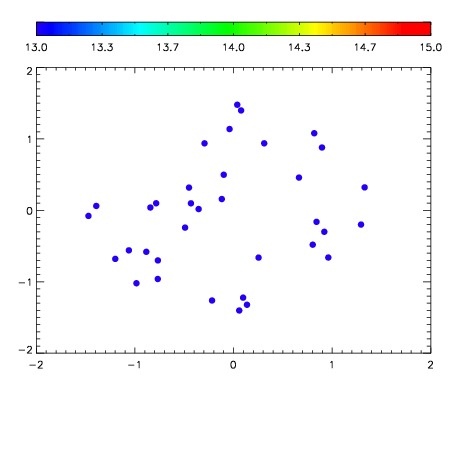

| Frame | Nreads | Zeropoints | Mag plots | Spatial mag deviation | Spatial sky 16325A emission deviations (filled: sky, open: star) | Spatial sky continuum emission | Spatial sky telluric CO2 absorption deviations (filled: H < 10) | |||||||||||||||||||||||
| 0 | 0 |
|
|
|
|
|
|
| IPAIR | NAME | SHIFT | NEWSHIFT | S/N | NAME | SHIFT | NEWSHIFT | S/N |
| 0 | 18490030 | 0.502977 | 0.00000 | 18.1131 | 18490028 | 0.00164291 | 0.501334 | 18.0791 |
| 1 | 18490026 | 0.502414 | 0.000563025 | 18.6773 | 18490024 | 0.00000 | 0.502977 | 18.7324 |
| 2 | 18490025 | 0.502427 | 0.000550032 | 18.5185 | 18490027 | 0.00165881 | 0.501318 | 18.4425 |
| 3 | 18490029 | 0.502968 | 9.00030e-06 | 17.7304 | 18490031 | 0.00171957 | 0.501257 | 17.9911 |