| Red | Green | Blue | |
| z | 17.64 | ||
| znorm | Inf | ||
| sky | -Inf | -Inf | -Inf |
| S/N | 27.5 | 47.7 | 51.5 |
| S/N(c) | 0.0 | 0.0 | 0.0 |
| SN(E/C) |
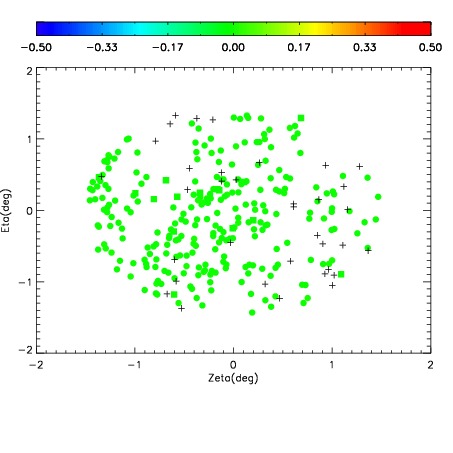
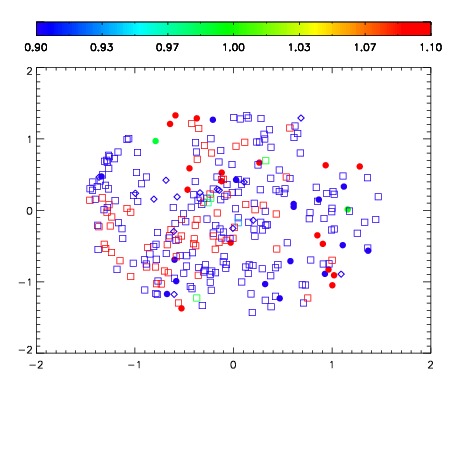


| Frame | Nreads | Zeropoints | Mag plots | Spatial mag deviation | Spatial sky 16325A emission deviations (filled: sky, open: star) | Spatial sky continuum emission | Spatial sky telluric CO2 absorption deviations (filled: H < 10) | |||||||||||||||||||||||
| 0 | 0 |
|
|
|
|
|
|
| IPAIR | NAME | SHIFT | NEWSHIFT | S/N | NAME | SHIFT | NEWSHIFT | S/N |
| 0 | 18460035 | 0.502670 | 0.00000 | 18.5816 | 18460037 | 0.00296474 | 0.499705 | 18.6357 |
| 1 | 18460032 | 0.500737 | 0.00193298 | 18.8475 | 18460034 | 0.00270079 | 0.499969 | 18.7198 |
| 2 | 18460031 | 0.501024 | 0.00164598 | 18.7539 | 18460033 | 0.00269441 | 0.499976 | 18.6771 |
| 3 | 18460036 | 0.502245 | 0.000424981 | 18.5162 | 18460030 | 0.00155644 | 0.501114 | 18.6084 |
| 4 | 18460027 | 0.501405 | 0.00126499 | 18.4725 | 18460029 | 0.00170222 | 0.500968 | 18.5679 |
| 5 | 18460028 | 0.501666 | 0.00100398 | 18.4220 | 18460026 | 0.00000 | 0.502670 | 18.5430 |