| Red | Green | Blue | |
| z | 17.64 | ||
| znorm | Inf | ||
| sky | -NaN | -NaN | -NaN |
| S/N | 29.0 | 46.6 | 54.7 |
| S/N(c) | 0.0 | 0.0 | 0.0 |
| SN(E/C) |
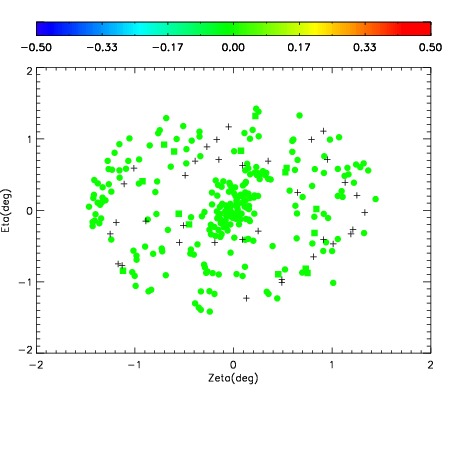
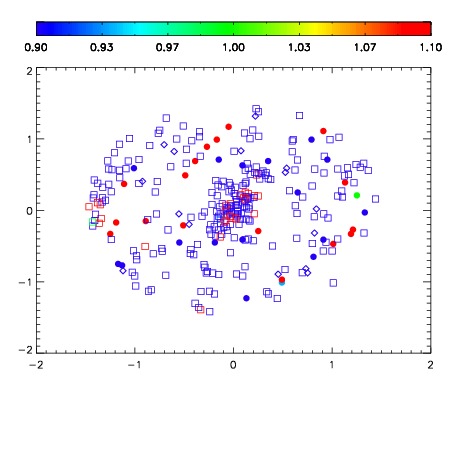
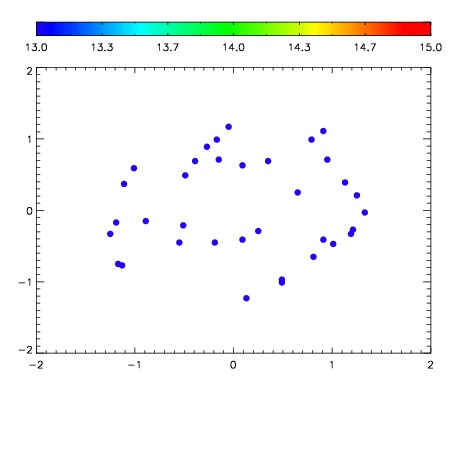

| Frame | Nreads | Zeropoints | Mag plots | Spatial mag deviation | Spatial sky 16325A emission deviations (filled: sky, open: star) | Spatial sky continuum emission | Spatial sky telluric CO2 absorption deviations (filled: H < 10) | |||||||||||||||||||||||
| 0 | 0 |
|
|
|
|
|
|
| IPAIR | NAME | SHIFT | NEWSHIFT | S/N | NAME | SHIFT | NEWSHIFT | S/N |
| 0 | 18710029 | 0.000602101 | 0.00000 | 18.9633 | 18710026 | -0.508910 | 0.509512 | 18.9635 |
| 1 | 18710033 | -0.00176446 | 0.00236656 | 18.9384 | 18710030 | -0.507473 | 0.508075 | 18.9203 |
| 2 | 18710025 | 0.00000 | 0.000602101 | 18.9198 | 18710034 | -0.507246 | 0.507848 | 18.8949 |
| 3 | 18710028 | 0.000594913 | 7.18795e-06 | 18.9075 | 18710031 | -0.506717 | 0.507319 | 18.8923 |
| 4 | 18710032 | -0.00226017 | 0.00286227 | 18.8385 | 18710027 | -0.509334 | 0.509936 | 18.8883 |