| Red | Green | Blue | |
| z | 17.64 | ||
| znorm | Inf | ||
| sky | -Inf | -Inf | -Inf |
| S/N | 30.5 | 48.8 | 53.9 |
| S/N(c) | 0.0 | 0.0 | 0.0 |
| SN(E/C) |
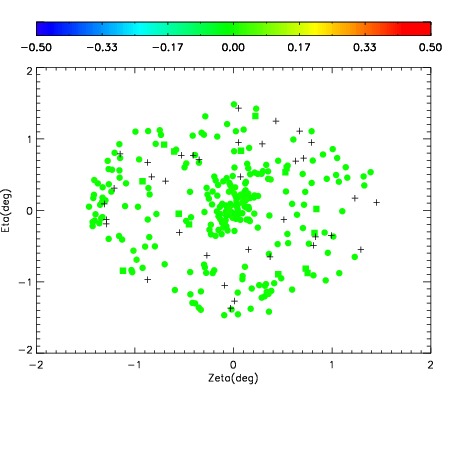
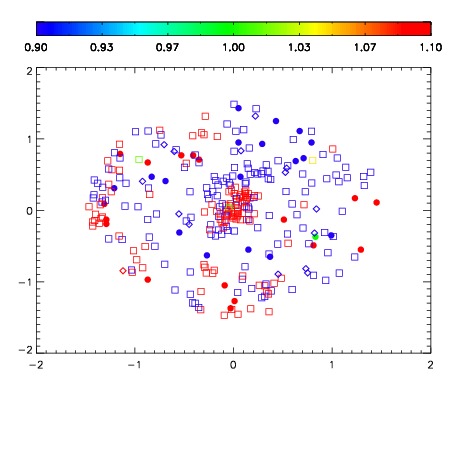
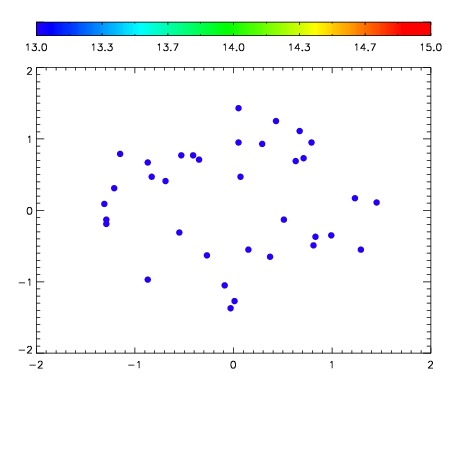

| Frame | Nreads | Zeropoints | Mag plots | Spatial mag deviation | Spatial sky 16325A emission deviations (filled: sky, open: star) | Spatial sky continuum emission | Spatial sky telluric CO2 absorption deviations (filled: H < 10) | |||||||||||||||||||||||
| 0 | 0 |
|
|
|
|
|
|
| IPAIR | NAME | SHIFT | NEWSHIFT | S/N | NAME | SHIFT | NEWSHIFT | S/N |
| 0 | 18810013 | 0.509153 | 0.00000 | 18.9048 | 18810014 | 0.00142934 | 0.507724 | 18.8882 |
| 1 | 18810016 | 0.507301 | 0.00185204 | 18.9685 | 18810015 | 0.00179459 | 0.507358 | 18.9569 |
| 2 | 18810021 | 0.507188 | 0.00196499 | 18.9212 | 18810022 | 0.00171391 | 0.507439 | 18.9450 |
| 3 | 18810020 | 0.507108 | 0.00204504 | 18.8535 | 18810011 | 0.00000 | 0.509153 | 18.8864 |
| 4 | 18810017 | 0.507457 | 0.00169599 | 18.8259 | 18810019 | 0.00107007 | 0.508083 | 18.8601 |
| 5 | 18810012 | 0.508986 | 0.000167012 | 18.7948 | 18810018 | 0.00137454 | 0.507778 | 18.8460 |