| Red | Green | Blue | |
| z | 17.64 | ||
| znorm | Inf | ||
| sky | -Inf | -Inf | -NaN |
| S/N | 28.4 | 46.8 | 52.2 |
| S/N(c) | 0.0 | 0.0 | 0.0 |
| SN(E/C) |
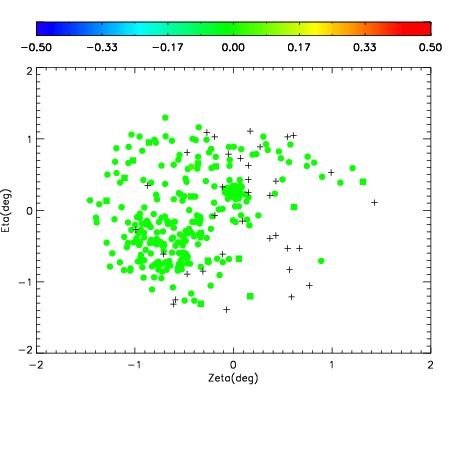
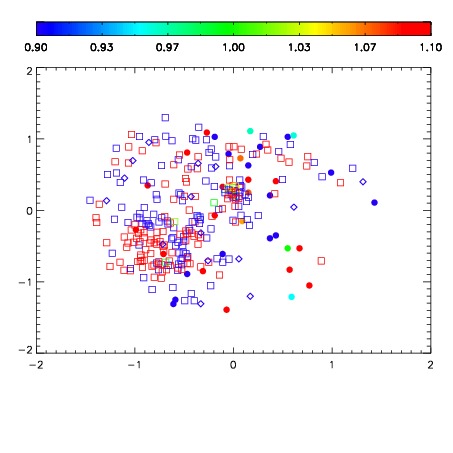
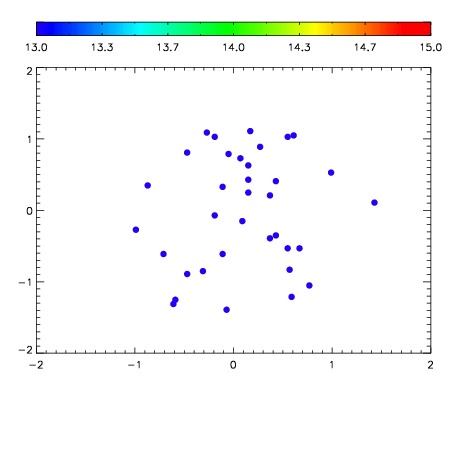

| Frame | Nreads | Zeropoints | Mag plots | Spatial mag deviation | Spatial sky 16325A emission deviations (filled: sky, open: star) | Spatial sky continuum emission | Spatial sky telluric CO2 absorption deviations (filled: H < 10) | |||||||||||||||||||||||
| 0 | 0 |
|
|
|
|
|
|
| IPAIR | NAME | SHIFT | NEWSHIFT | S/N | NAME | SHIFT | NEWSHIFT | S/N |
| 0 | 18720021 | 0.512902 | 0.00000 | 18.8079 | 18720018 | 0.00197333 | 0.510929 | 18.7491 |
| 1 | 18720013 | 0.511475 | 0.00142699 | 18.8905 | 18720022 | 0.00268410 | 0.510218 | 18.8414 |
| 2 | 18720012 | 0.510714 | 0.00218803 | 18.8470 | 18720019 | 0.00155945 | 0.511343 | 18.7722 |
| 3 | 18720020 | 0.512035 | 0.000867009 | 18.8243 | 18720011 | 0.00000 | 0.512902 | 18.7569 |
| 4 | 18720016 | 0.512488 | 0.000414014 | 18.6561 | 18720015 | 0.00283325 | 0.510069 | 18.6870 |
| 5 | 18720017 | 0.512125 | 0.000777006 | 18.6502 | 18720014 | 0.00305935 | 0.509843 | 18.6639 |