| Red | Green | Blue | |
| z | 17.64 | ||
| znorm | Inf | ||
| sky | -NaN | -NaN | -NaN |
| S/N | 30.9 | 49.7 | 54.2 |
| S/N(c) | 0.0 | 0.0 | 0.0 |
| SN(E/C) |
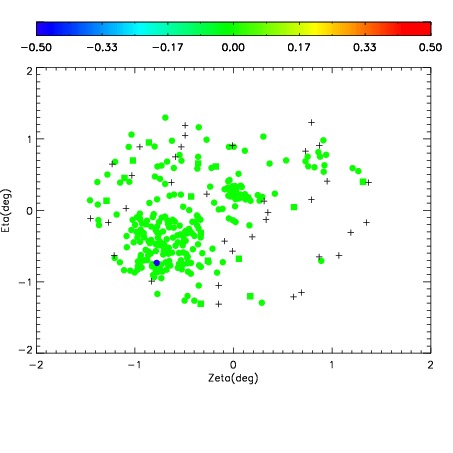
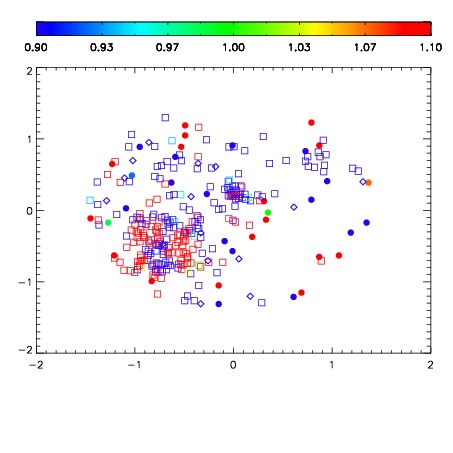
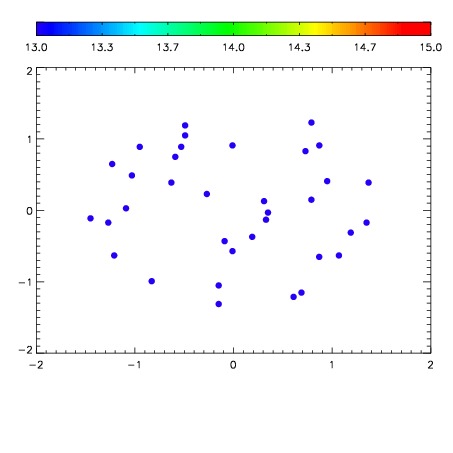

| Frame | Nreads | Zeropoints | Mag plots | Spatial mag deviation | Spatial sky 16325A emission deviations (filled: sky, open: star) | Spatial sky continuum emission | Spatial sky telluric CO2 absorption deviations (filled: H < 10) | |||||||||||||||||||||||
| 0 | 0 |
|
|
|
|
|
|
| IPAIR | NAME | SHIFT | NEWSHIFT | S/N | NAME | SHIFT | NEWSHIFT | S/N |
| 0 | 18730013 | 0.505217 | 0.00000 | 19.0726 | 18730014 | 0.000644705 | 0.504572 | 19.0740 |
| 1 | 18730012 | 0.504801 | 0.000416040 | 19.0608 | 18730015 | -3.08031e-05 | 0.505248 | 18.9658 |
| 2 | 18730020 | 0.504610 | 0.000607014 | 18.9797 | 18730018 | -0.00215834 | 0.507375 | 18.9636 |
| 3 | 18730016 | 0.503808 | 0.00140899 | 18.9295 | 18730019 | -0.00222395 | 0.507441 | 18.9246 |
| 4 | 18730017 | 0.504509 | 0.000708044 | 18.9131 | 18730011 | 0.00000 | 0.505217 | 18.7264 |