| Red | Green | Blue | |
| z | 17.64 | ||
| znorm | Inf | ||
| sky | -Inf | -Inf | -Inf |
| S/N | 27.2 | 45.7 | 50.4 |
| S/N(c) | 0.0 | 0.0 | 0.0 |
| SN(E/C) |
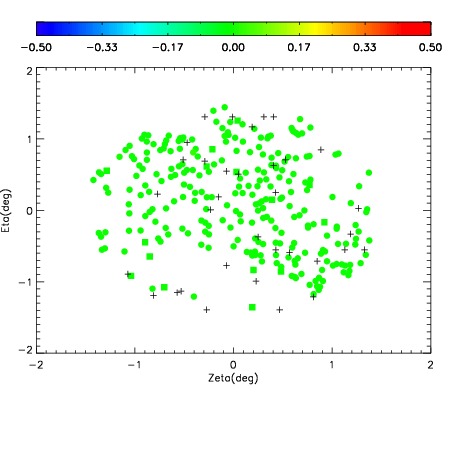
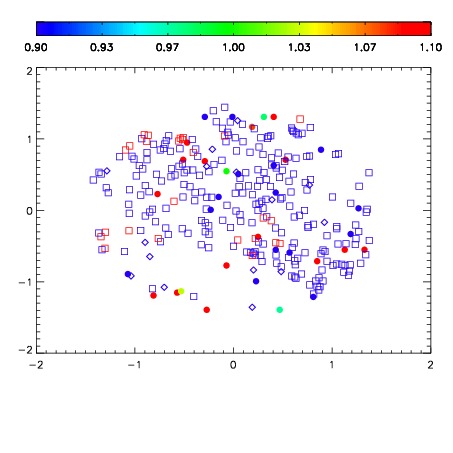
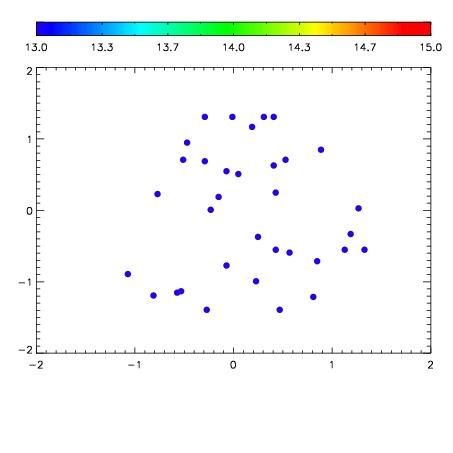

| Frame | Nreads | Zeropoints | Mag plots | Spatial mag deviation | Spatial sky 16325A emission deviations (filled: sky, open: star) | Spatial sky continuum emission | Spatial sky telluric CO2 absorption deviations (filled: H < 10) | |||||||||||||||||||||||
| 0 | 0 |
|
|
|
|
|
|
| IPAIR | NAME | SHIFT | NEWSHIFT | S/N | NAME | SHIFT | NEWSHIFT | S/N |
| 0 | 18480031 | 0.503141 | 0.00000 | 18.8872 | 18480032 | 0.00168799 | 0.501453 | 19.0239 |
| 1 | 18480034 | 0.502705 | 0.000436008 | 18.9318 | 18480033 | 0.000978564 | 0.502162 | 19.0725 |
| 2 | 18480035 | 0.502509 | 0.000631988 | 18.8231 | 18480036 | 0.00171038 | 0.501431 | 18.9245 |
| 3 | 18480030 | 0.502782 | 0.000358999 | 18.7539 | 18480029 | 0.00000 | 0.503141 | 18.6429 |