| Red | Green | Blue | |
| z | 17.64 | ||
| znorm | Inf | ||
| sky | -Inf | -Inf | -NaN |
| S/N | 21.9 | 35.9 | 39.2 |
| S/N(c) | 0.0 | 0.0 | 0.0 |
| SN(E/C) |

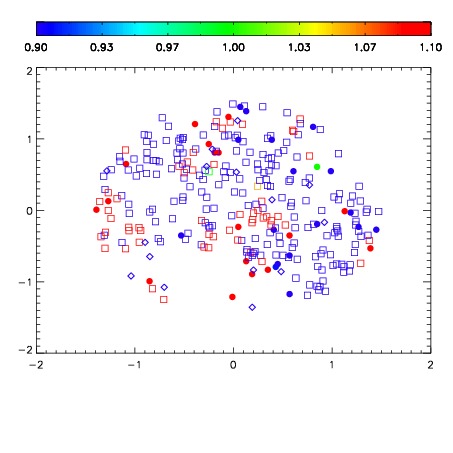
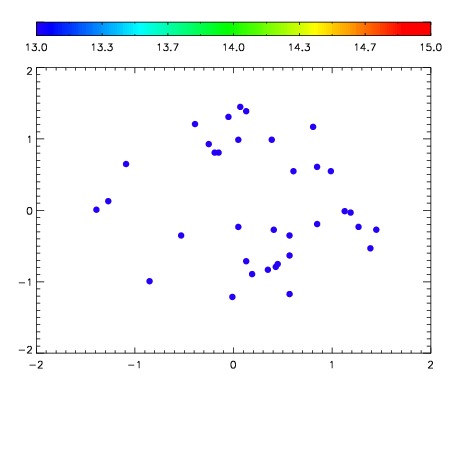

| Frame | Nreads | Zeropoints | Mag plots | Spatial mag deviation | Spatial sky 16325A emission deviations (filled: sky, open: star) | Spatial sky continuum emission | Spatial sky telluric CO2 absorption deviations (filled: H < 10) | |||||||||||||||||||||||
| 0 | 0 |
|
|
|
|
|
|
| IPAIR | NAME | SHIFT | NEWSHIFT | S/N | NAME | SHIFT | NEWSHIFT | S/N |
| 0 | 18490041 | 0.503271 | 0.00000 | 18.6856 | 18490042 | 0.00248077 | 0.500790 | 18.3648 |
| 1 | 18490037 | 0.501417 | 0.00185400 | 19.0042 | 18490038 | 0.00157129 | 0.501700 | 18.9096 |
| 2 | 18490036 | 0.501150 | 0.00212097 | 18.8982 | 18490039 | 0.00244495 | 0.500826 | 18.5888 |
| 3 | 18490040 | 0.502622 | 0.000648975 | 18.7524 | 18490035 | 0.00000 | 0.503271 | 18.4214 |