| Red | Green | Blue | |
| z | 17.64 | ||
| znorm | Inf | ||
| sky | -NaN | -NaN | -NaN |
| S/N | 19.9 | 32.0 | 37.0 |
| S/N(c) | 0.0 | 0.0 | 0.0 |
| SN(E/C) |
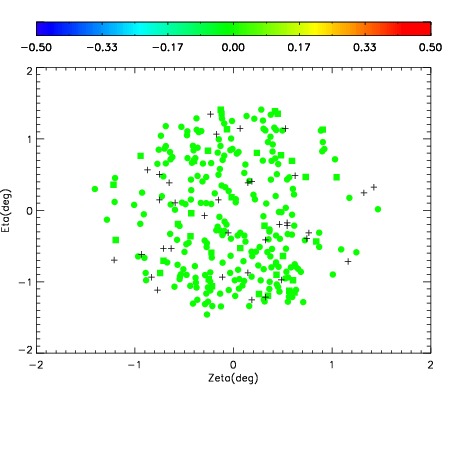
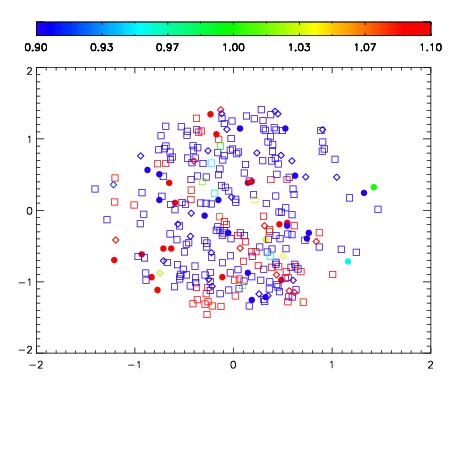
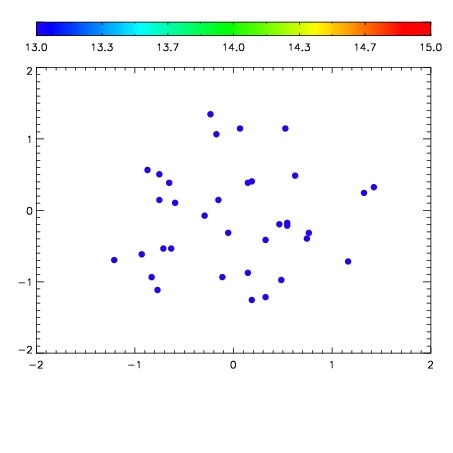

| Frame | Nreads | Zeropoints | Mag plots | Spatial mag deviation | Spatial sky 16325A emission deviations (filled: sky, open: star) | Spatial sky continuum emission | Spatial sky telluric CO2 absorption deviations (filled: H < 10) | |||||||||||||||||||||||
| 0 | 0 |
|
|
|
|
|
|
| IPAIR | NAME | SHIFT | NEWSHIFT | S/N | NAME | SHIFT | NEWSHIFT | S/N |
| 0 | 18780030 | 0.508756 | 0.00000 | 18.3051 | 18780031 | 0.000595283 | 0.508161 | 18.2135 |
| 1 | 18780029 | 0.507755 | 0.00100100 | 18.7344 | 18780028 | 0.00114067 | 0.507615 | 18.5825 |
| 2 | 18780026 | 0.508453 | 0.000302970 | 17.6801 | 18780027 | 0.00190463 | 0.506851 | 17.9522 |
| 3 | 18780025 | 0.508479 | 0.000276983 | 17.4382 | 18780024 | 0.00000 | 0.508756 | 17.3117 |