| Red | Green | Blue | |
| z | 17.64 | ||
| znorm | Inf | ||
| sky | -Inf | -Inf | -NaN |
| S/N | 24.9 | 38.6 | 44.2 |
| S/N(c) | 0.0 | 0.0 | 0.0 |
| SN(E/C) |
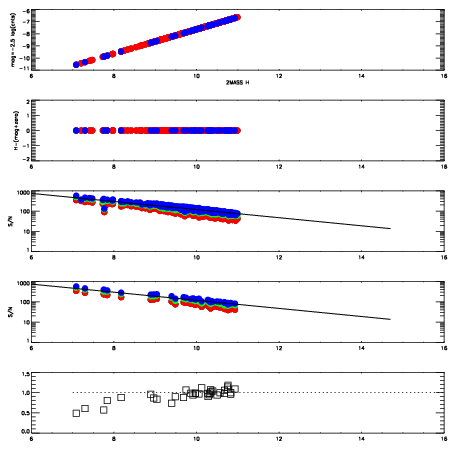
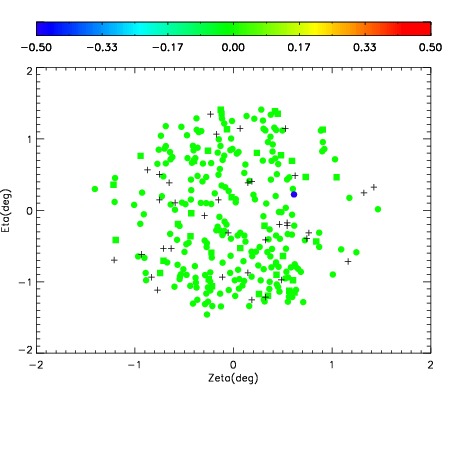
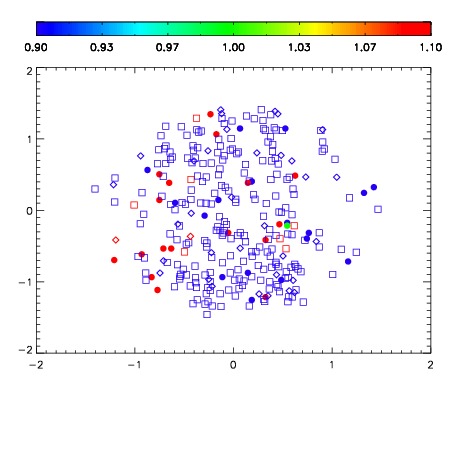
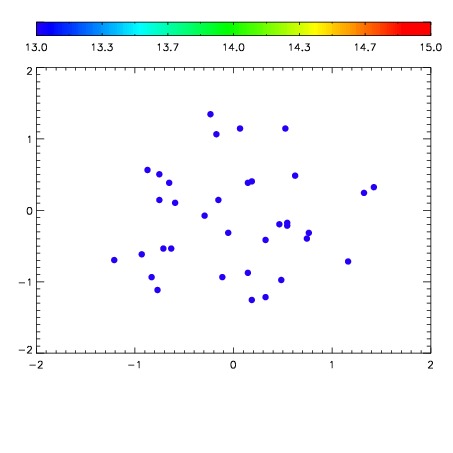

| Frame | Nreads | Zeropoints | Mag plots | Spatial mag deviation | Spatial sky 16325A emission deviations (filled: sky, open: star) | Spatial sky continuum emission | Spatial sky telluric CO2 absorption deviations (filled: H < 10) | |||||||||||||||||||||||
| 0 | 0 |
|
|
|
|
|
|
| IPAIR | NAME | SHIFT | NEWSHIFT | S/N | NAME | SHIFT | NEWSHIFT | S/N |
| 0 | 19010017 | 0.501840 | 0.00000 | 18.3945 | 19010018 | 0.00251672 | 0.499323 | 18.3107 |
| 1 | 19010016 | 0.500269 | 0.00157100 | 18.6872 | 19010011 | 0.00000 | 0.501840 | 18.8171 |
| 2 | 19010012 | 0.498731 | 0.00310901 | 18.6567 | 19010014 | 0.00199896 | 0.499841 | 18.6173 |
| 3 | 19010013 | 0.499857 | 0.00198299 | 18.6181 | 19010015 | 0.00173851 | 0.500102 | 18.5356 |