| Red | Green | Blue | |
| z | 17.64 | ||
| znorm | Inf | ||
| sky | -Inf | -Inf | -Inf |
| S/N | 9.3 | 18.1 | 19.4 |
| S/N(c) | 0.0 | 0.0 | 0.0 |
| SN(E/C) |
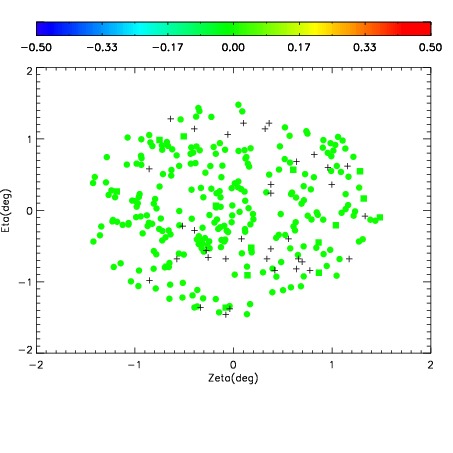
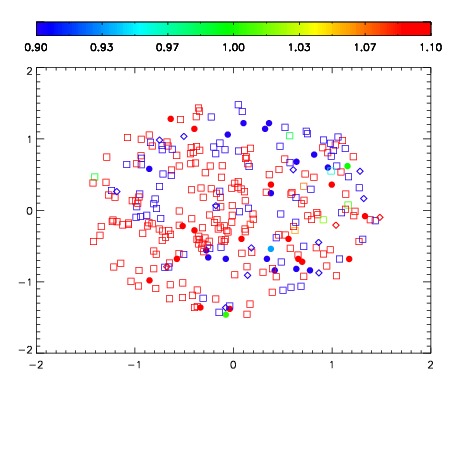
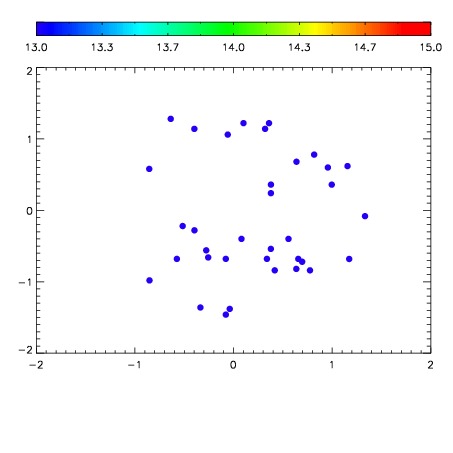

| Frame | Nreads | Zeropoints | Mag plots | Spatial mag deviation | Spatial sky 16325A emission deviations (filled: sky, open: star) | Spatial sky continuum emission | Spatial sky telluric CO2 absorption deviations (filled: H < 10) | |||||||||||||||||||||||
| 0 | 0 |
|
|
|
|
|
|
| IPAIR | NAME | SHIFT | NEWSHIFT | S/N | NAME | SHIFT | NEWSHIFT | S/N |
| 0 | 18780019 | 0.509211 | 0.00000 | 17.2589 | 18780020 | 0.00191327 | 0.507298 | 17.6343 |
| 1 | 18780014 | 0.508022 | 0.00118899 | 17.7371 | 18780013 | 0.00000 | 0.509211 | 17.7015 |
| 2 | 18780015 | 0.508710 | 0.000500977 | 17.7076 | 18780017 | 0.00168042 | 0.507531 | 17.6896 |
| 3 | 18780018 | 0.508568 | 0.000643015 | 17.3803 | 18780016 | 0.00224491 | 0.506966 | 17.6595 |