| Red | Green | Blue | |
| z | 17.64 | ||
| znorm | Inf | ||
| sky | -Inf | -NaN | -Inf |
| S/N | 27.6 | 43.9 | 52.8 |
| S/N(c) | 58.1 | 98.6 | 41.8 |
| SN(E/C) |
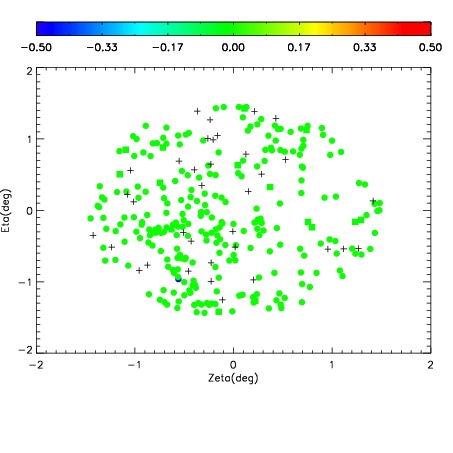
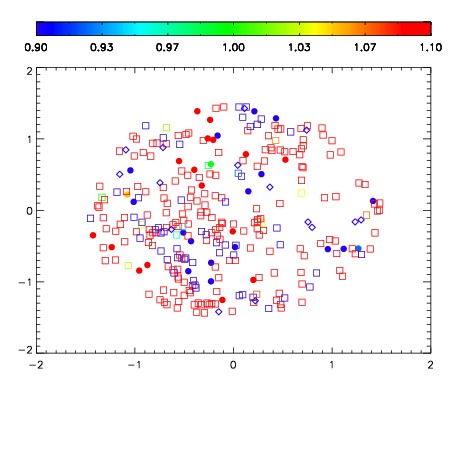
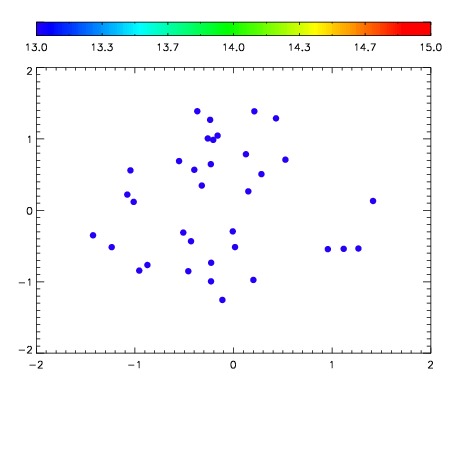

| Frame | Nreads | Zeropoints | Mag plots | Spatial mag deviation | Spatial sky 16325A emission deviations (filled: sky, open: star) | Spatial sky continuum emission | Spatial sky telluric CO2 absorption deviations (filled: H < 10) | |||||||||||||||||||||||
| 0 | 0 |
|
|
|
|
|
|
| IPAIR | NAME | SHIFT | NEWSHIFT | S/N | NAME | SHIFT | NEWSHIFT | S/N |
| 0 | 18730038 | 0.00000 | 0.00000 | 19.1070 | 18730039 | -0.507174 | 0.507174 | 19.0683 |
| 1 | 18730045 | -0.000622387 | 0.000622387 | 19.1964 | 18730043 | -0.503040 | 0.503040 | 19.1017 |
| 2 | 18730042 | -0.00215850 | 0.00215850 | 19.1112 | 18730040 | -0.507121 | 0.507121 | 19.0806 |
| 3 | 18730041 | -0.00254262 | 0.00254262 | 19.0475 | 18730044 | -0.503167 | 0.503167 | 19.0638 |