| Red | Green | Blue | |
| z | 17.64 | ||
| znorm | Inf | ||
| sky | -Inf | -Inf | -Inf |
| S/N | 34.4 | 53.4 | 65.1 |
| S/N(c) | 66.1 | 28.7 | 134.8 |
| SN(E/C) |
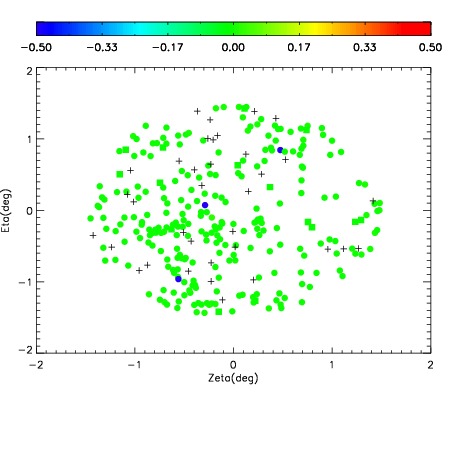
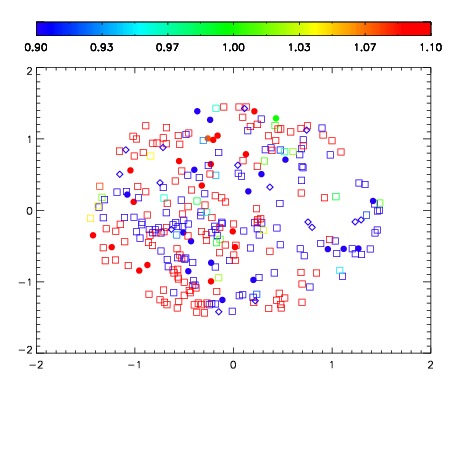
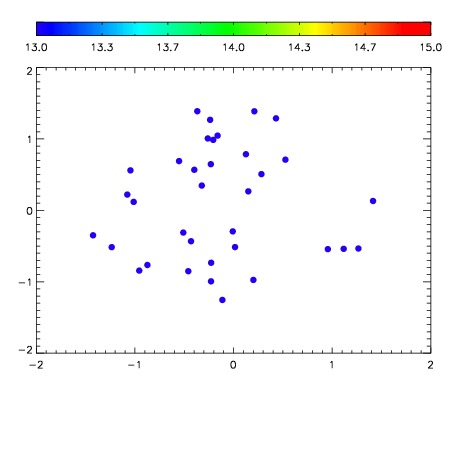

| Frame | Nreads | Zeropoints | Mag plots | Spatial mag deviation | Spatial sky 16325A emission deviations (filled: sky, open: star) | Spatial sky continuum emission | Spatial sky telluric CO2 absorption deviations (filled: H < 10) | |||||||||||||||||||||||
| 0 | 0 |
|
|
|
|
|
|
| IPAIR | NAME | SHIFT | NEWSHIFT | S/N | NAME | SHIFT | NEWSHIFT | S/N |
| 0 | 18820055 | 0.501120 | 0.00000 | 19.1840 | 18820056 | 0.00603337 | 0.495087 | 19.1382 |
| 1 | 18820058 | 0.500003 | 0.00111699 | 19.2149 | 18820053 | 0.00000 | 0.501120 | 19.2173 |
| 2 | 18820059 | 0.499905 | 0.00121498 | 19.1984 | 18820060 | -0.000151216 | 0.501271 | 19.1996 |
| 3 | 18820054 | 0.500537 | 0.000582993 | 19.1913 | 18820057 | 0.00491431 | 0.496206 | 19.1790 |