| Red | Green | Blue | |
| z | 17.65 | ||
| znorm | Inf | ||
| sky | -Inf | -Inf | -Inf |
| S/N | 29.5 | 46.3 | 55.7 |
| S/N(c) | 52.8 | 92.8 | 0.8 |
| SN(E/C) |
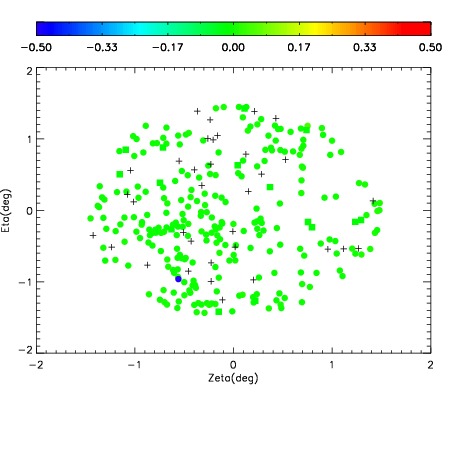
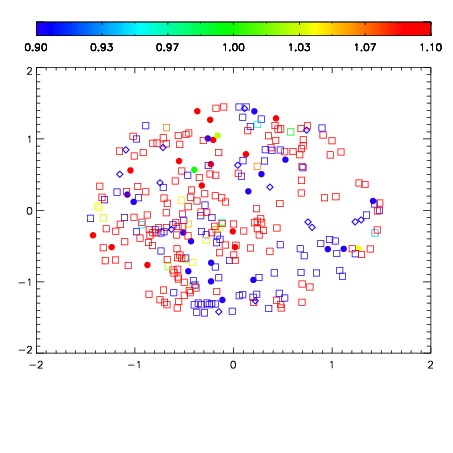
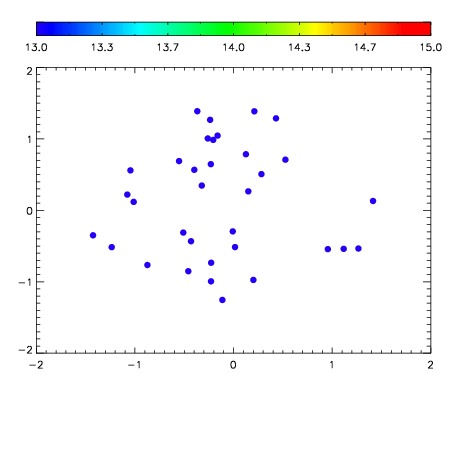

| Frame | Nreads | Zeropoints | Mag plots | Spatial mag deviation | Spatial sky 16325A emission deviations (filled: sky, open: star) | Spatial sky continuum emission | Spatial sky telluric CO2 absorption deviations (filled: H < 10) | |||||||||||||||||||||||
| 0 | 0 |
|
|
|
|
|
|
| IPAIR | NAME | SHIFT | NEWSHIFT | S/N | NAME | SHIFT | NEWSHIFT | S/N |
| 0 | 19050025 | 0.500457 | 0.00000 | 18.9736 | 19050027 | 0.000595134 | 0.499862 | 18.9329 |
| 1 | 19050024 | 0.500212 | 0.000244975 | 19.0056 | 19050026 | 0.000426586 | 0.500030 | 18.9968 |
| 2 | 19050029 | 0.500260 | 0.000196993 | 18.9331 | 19050023 | 0.00000 | 0.500457 | 18.9242 |
| 3 | 19050028 | 0.499705 | 0.000752002 | 18.9149 | 19050030 | -0.000508445 | 0.500965 | 18.7679 |