| Red | Green | Blue | |
| z | 17.65 | ||
| znorm | Inf | ||
| sky | -Inf | -Inf | -Inf |
| S/N | 32.9 | 51.0 | 61.6 |
| S/N(c) | 64.8 | 0.7 | 95.1 |
| SN(E/C) |
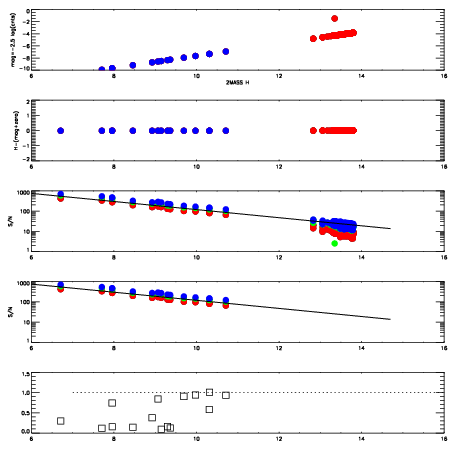
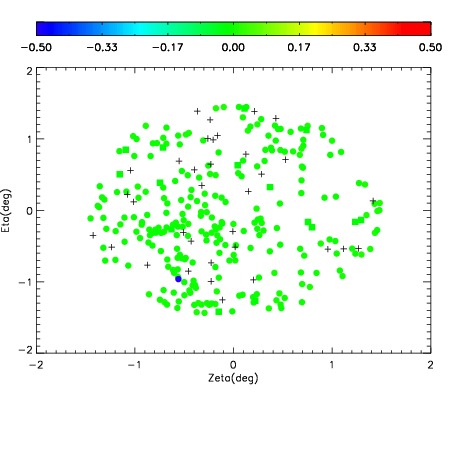
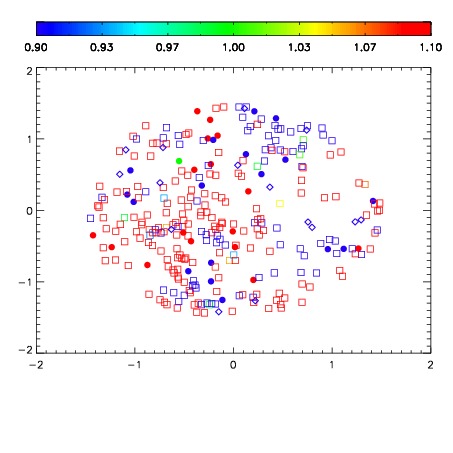
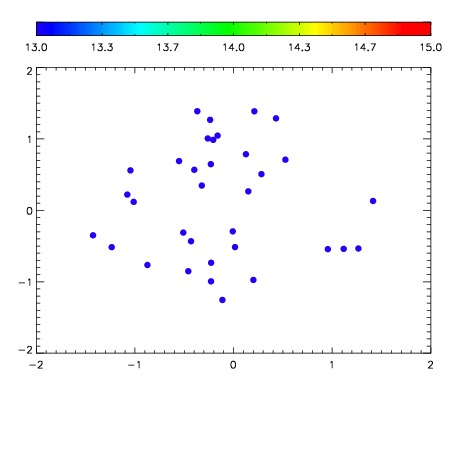

| Frame | Nreads | Zeropoints | Mag plots | Spatial mag deviation | Spatial sky 16325A emission deviations (filled: sky, open: star) | Spatial sky continuum emission | Spatial sky telluric CO2 absorption deviations (filled: H < 10) | |||||||||||||||||||||||
| 0 | 0 |
|
|
|
|
|
|
| IPAIR | NAME | SHIFT | NEWSHIFT | S/N | NAME | SHIFT | NEWSHIFT | S/N |
| 0 | 19100027 | 0.00339379 | 0.00000 | 19.1694 | 19100028 | -0.498040 | 0.501434 | 19.1583 |
| 1 | 19100026 | 0.00253948 | 0.000854310 | 19.1419 | 19100024 | -0.499943 | 0.503337 | 19.1432 |
| 2 | 19100030 | 0.00183908 | 0.00155471 | 19.1305 | 19100029 | -0.499086 | 0.502480 | 19.1075 |
| 3 | 19100023 | 0.00000 | 0.00339379 | 19.1056 | 19100025 | -0.500526 | 0.503920 | 19.0744 |