| Red | Green | Blue | |
| z | 17.64 | ||
| znorm | Inf | ||
| sky | -Inf | -Inf | -NaN |
| S/N | 29.9 | 46.9 | 56.7 |
| S/N(c) | 61.7 | 26.5 | 121.2 |
| SN(E/C) |
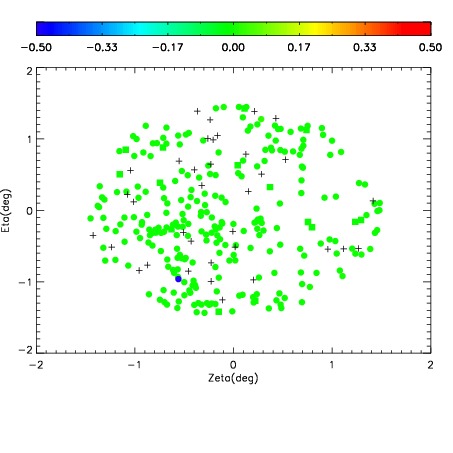
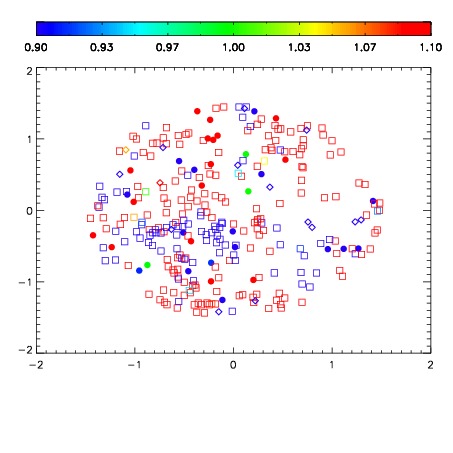
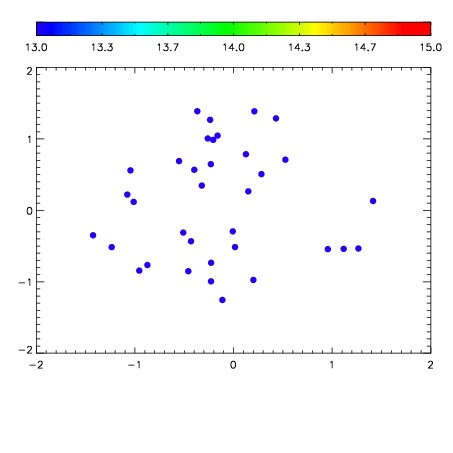

| Frame | Nreads | Zeropoints | Mag plots | Spatial mag deviation | Spatial sky 16325A emission deviations (filled: sky, open: star) | Spatial sky continuum emission | Spatial sky telluric CO2 absorption deviations (filled: H < 10) | |||||||||||||||||||||||
| 0 | 0 |
|
|
|
|
|
|
| IPAIR | NAME | SHIFT | NEWSHIFT | S/N | NAME | SHIFT | NEWSHIFT | S/N |
| 0 | 19310017 | 0.494666 | 0.00000 | 19.2094 | 19310018 | 0.00460731 | 0.490059 | 19.1977 |
| 1 | 19310012 | 0.493033 | 0.00163302 | 19.9253 | 19310011 | 0.00000 | 0.494666 | 19.7628 |
| 2 | 19310016 | 0.494508 | 0.000158012 | 19.2114 | 19310015 | 0.00243974 | 0.492226 | 19.2086 |
| 3 | 19310013 | 0.493650 | 0.00101602 | 19.1381 | 19310014 | 0.00273826 | 0.491928 | 19.1794 |