| Red | Green | Blue | |
| z | 17.64 | ||
| znorm | Inf | ||
| sky | -NaN | -NaN | -Inf |
| S/N | 22.9 | 32.5 | 40.1 |
| S/N(c) | 63.1 | 27.4 | 29.5 |
| SN(E/C) |
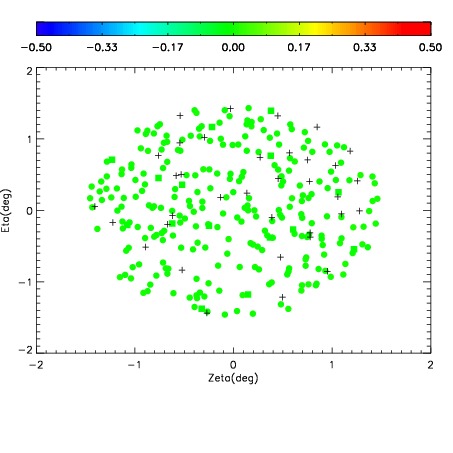
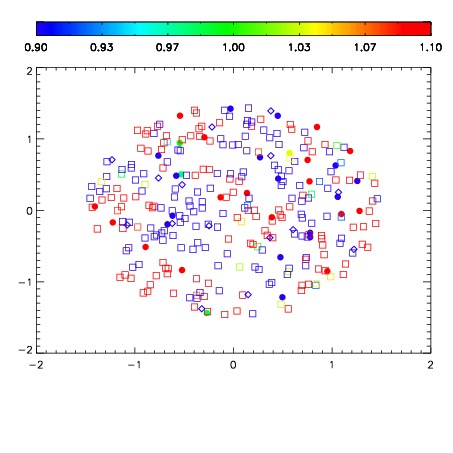
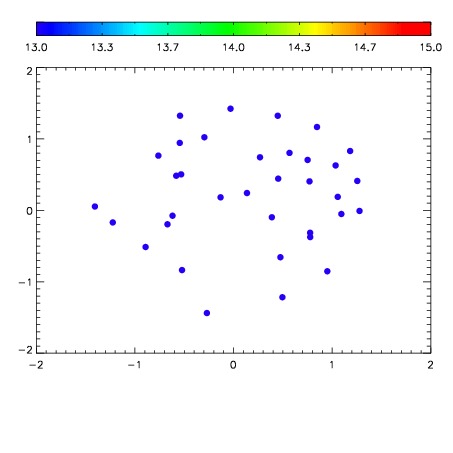

| Frame | Nreads | Zeropoints | Mag plots | Spatial mag deviation | Spatial sky 16325A emission deviations (filled: sky, open: star) | Spatial sky continuum emission | Spatial sky telluric CO2 absorption deviations (filled: H < 10) | |||||||||||||||||||||||
| 0 | 0 |
|
|
|
|
|
|
| IPAIR | NAME | SHIFT | NEWSHIFT | S/N | NAME | SHIFT | NEWSHIFT | S/N |
| 0 | 19330021 | 0.494069 | 0.00000 | 18.9359 | 19330023 | 0.00328562 | 0.490783 | 18.8430 |
| 1 | 19330022 | 0.494012 | 5.70118e-05 | 18.9327 | 19330020 | 0.00000 | 0.494069 | 18.8369 |