| Red | Green | Blue | |
| z | 17.64 | ||
| znorm | Inf | ||
| sky | -Inf | -Inf | -Inf |
| S/N | 40.1 | 59.2 | 73.5 |
| S/N(c) | 112.2 | 48.6 | 78.2 |
| SN(E/C) |
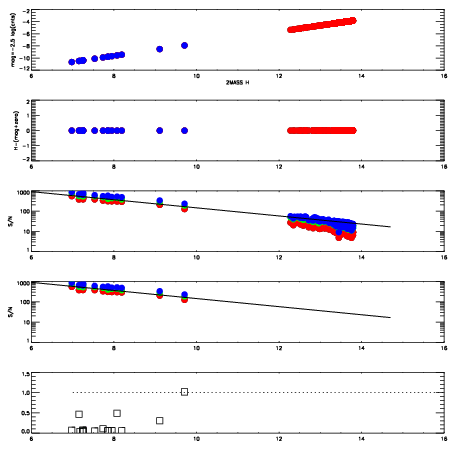
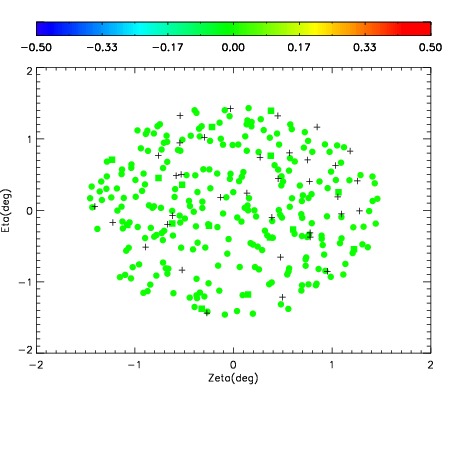
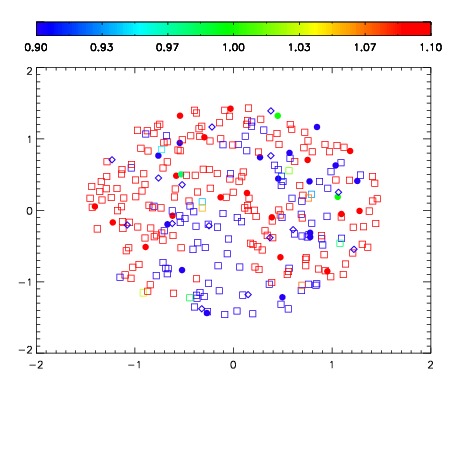
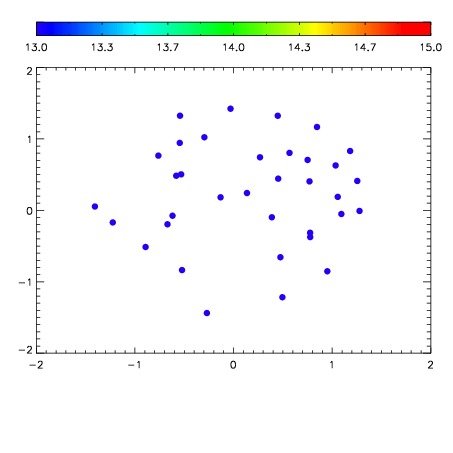

| Frame | Nreads | Zeropoints | Mag plots | Spatial mag deviation | Spatial sky 16325A emission deviations (filled: sky, open: star) | Spatial sky continuum emission | Spatial sky telluric CO2 absorption deviations (filled: H < 10) | |||||||||||||||||||||||
| 0 | 0 |
|
|
|
|
|
|
| IPAIR | NAME | SHIFT | NEWSHIFT | S/N | NAME | SHIFT | NEWSHIFT | S/N |
| 0 | 19370021 | 0.00179701 | 0.00000 | 18.9378 | 19370020 | -0.482776 | 0.484573 | 18.9493 |
| 1 | 19370029 | -0.00213701 | 0.00393402 | 19.0877 | 19370027 | -0.490652 | 0.492449 | 19.0610 |
| 2 | 19370025 | -0.00233936 | 0.00413637 | 19.0445 | 19370028 | -0.490674 | 0.492471 | 19.0474 |
| 3 | 19370026 | -0.000896284 | 0.00269329 | 19.0212 | 19370024 | -0.490923 | 0.492720 | 19.0225 |
| 4 | 19370022 | 0.00140594 | 0.000391070 | 18.9870 | 19370023 | -0.490566 | 0.492363 | 19.0199 |
| 5 | 19370018 | 0.00000 | 0.00179701 | 18.8420 | 19370019 | -0.482766 | 0.484563 | 18.8404 |