| Red | Green | Blue | |
| z | 17.64 | ||
| znorm | Inf | ||
| sky | -NaN | -NaN | -NaN |
| S/N | 33.6 | 51.7 | 61.5 |
| S/N(c) | 22.4 | 94.2 | 36.0 |
| SN(E/C) |
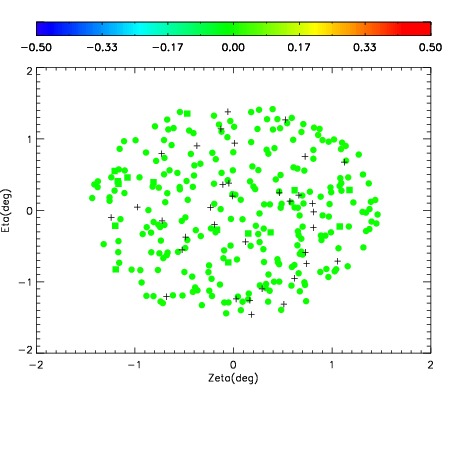
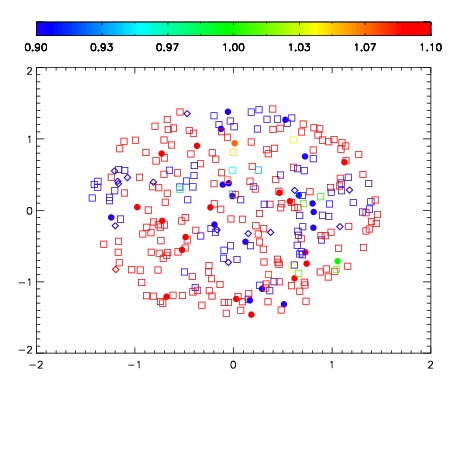
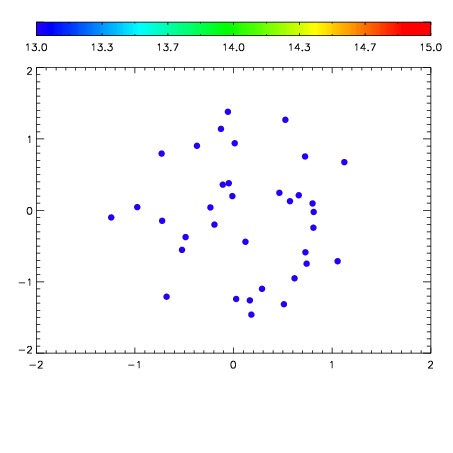

| Frame | Nreads | Zeropoints | Mag plots | Spatial mag deviation | Spatial sky 16325A emission deviations (filled: sky, open: star) | Spatial sky continuum emission | Spatial sky telluric CO2 absorption deviations (filled: H < 10) | |||||||||||||||||||||||
| 0 | 0 |
|
|
|
|
|
|
| IPAIR | NAME | SHIFT | NEWSHIFT | S/N | NAME | SHIFT | NEWSHIFT | S/N |
| 0 | 18830049 | 0.00000 | 0.00000 | 19.1189 | 18830050 | -0.498958 | 0.498958 | 19.0820 |
| 1 | 18830053 | -0.00108776 | 0.00108776 | 19.0444 | 18830051 | -0.499286 | 0.499286 | 19.0634 |
| 2 | 18830056 | -0.000837104 | 0.000837104 | 19.0307 | 18830055 | -0.500097 | 0.500097 | 19.0567 |
| 3 | 18830052 | -0.00161170 | 0.00161170 | 18.9891 | 18830054 | -0.500886 | 0.500886 | 19.0556 |