| Red | Green | Blue | |
| z | 17.64 | ||
| znorm | Inf | ||
| sky | -NaN | -NaN | -NaN |
| S/N | 28.4 | 43.2 | 52.8 |
| S/N(c) | 19.1 | 80.5 | 31.0 |
| SN(E/C) |
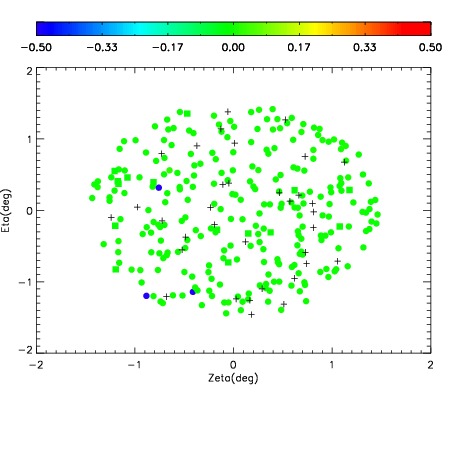
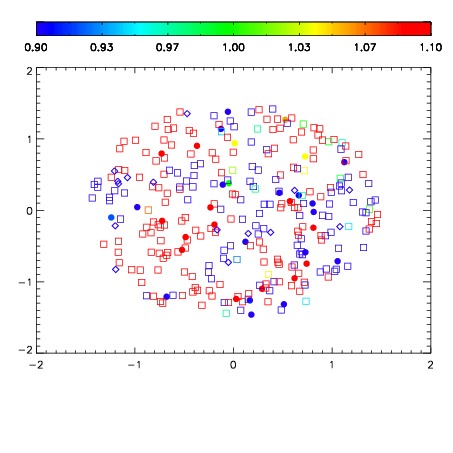
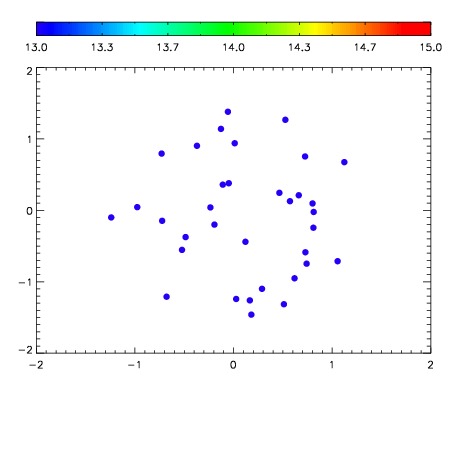

| Frame | Nreads | Zeropoints | Mag plots | Spatial mag deviation | Spatial sky 16325A emission deviations (filled: sky, open: star) | Spatial sky continuum emission | Spatial sky telluric CO2 absorption deviations (filled: H < 10) | |||||||||||||||||||||||
| 0 | 0 |
|
|
|
|
|
|
| IPAIR | NAME | SHIFT | NEWSHIFT | S/N | NAME | SHIFT | NEWSHIFT | S/N |
| 0 | 18860063 | 0.00383068 | 0.00000 | 18.7168 | 18860062 | -0.510733 | 0.514564 | 18.7132 |
| 1 | 18860059 | -0.00143947 | 0.00527015 | 18.7226 | 18860058 | -0.504332 | 0.508163 | 18.7741 |
| 2 | 18860056 | 0.00000 | 0.00383068 | 18.7113 | 18860057 | -0.503985 | 0.507816 | 18.6586 |
| 3 | 18860060 | -0.00115378 | 0.00498446 | 18.4004 | 18860061 | -0.510557 | 0.514388 | 18.5537 |