| Red | Green | Blue | |
| z | 17.64 | ||
| znorm | Inf | ||
| sky | -Inf | -NaN | -NaN |
| S/N | 34.7 | 54.2 | 65.6 |
| S/N(c) | 16.4 | 23.5 | 34.5 |
| SN(E/C) |
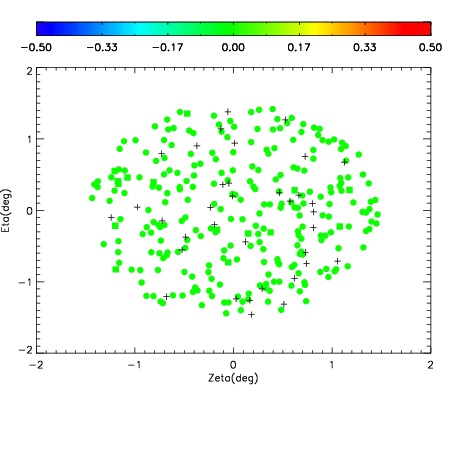
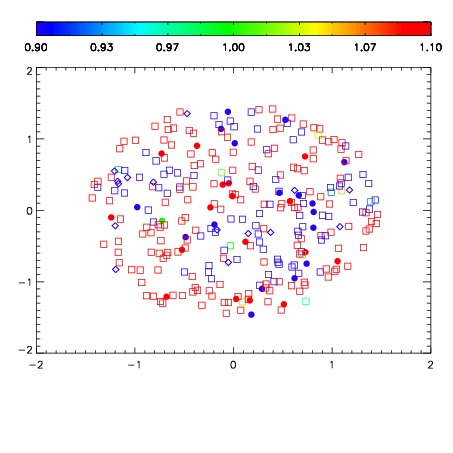
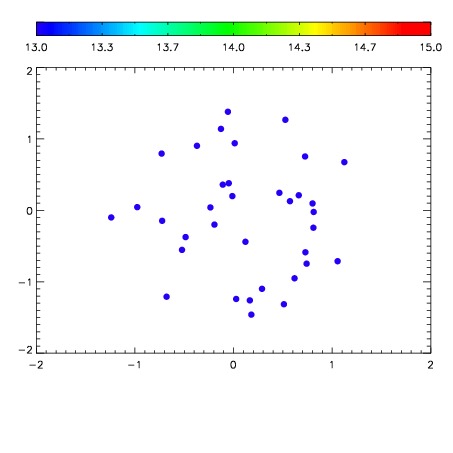

| Frame | Nreads | Zeropoints | Mag plots | Spatial mag deviation | Spatial sky 16325A emission deviations (filled: sky, open: star) | Spatial sky continuum emission | Spatial sky telluric CO2 absorption deviations (filled: H < 10) | |||||||||||||||||||||||
| 0 | 0 |
|
|
|
|
|
|
| IPAIR | NAME | SHIFT | NEWSHIFT | S/N | NAME | SHIFT | NEWSHIFT | S/N |
| 0 | 19010045 | 0.507430 | 0.00000 | 18.5559 | 19010036 | 0.00000 | 0.507430 | 18.6248 |
| 1 | 19010037 | 0.502158 | 0.00527203 | 18.8591 | 19010039 | 0.00159984 | 0.505830 | 18.8953 |
| 2 | 19010038 | 0.502502 | 0.00492799 | 18.7882 | 19010043 | 0.00167135 | 0.505759 | 18.8537 |
| 3 | 19010042 | 0.504147 | 0.00328302 | 18.6873 | 19010044 | 0.00153788 | 0.505892 | 18.7958 |
| 4 | 19010041 | 0.504094 | 0.00333601 | 18.5975 | 19010040 | 0.00142729 | 0.506003 | 18.7923 |
| 5 | 19010046 | 0.507360 | 7.00355e-05 | 18.4545 | 19010047 | 0.00144758 | 0.505982 | 18.4901 |