| Red | Green | Blue | |
| z | 17.64 | ||
| znorm | Inf | ||
| sky | -NaN | -NaN | -NaN |
| S/N | 33.0 | 51.9 | 63.7 |
| S/N(c) | 15.9 | 69.7 | 26.1 |
| SN(E/C) |
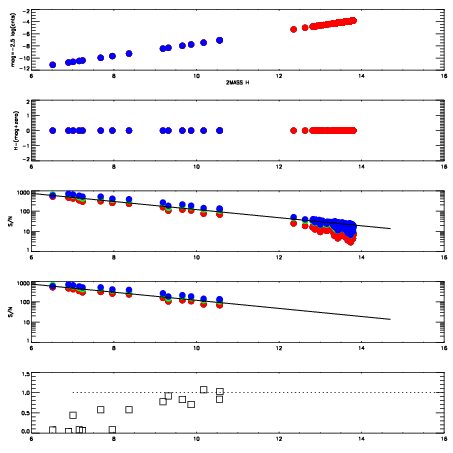
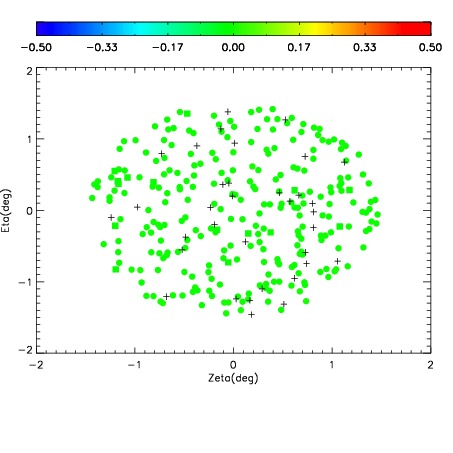
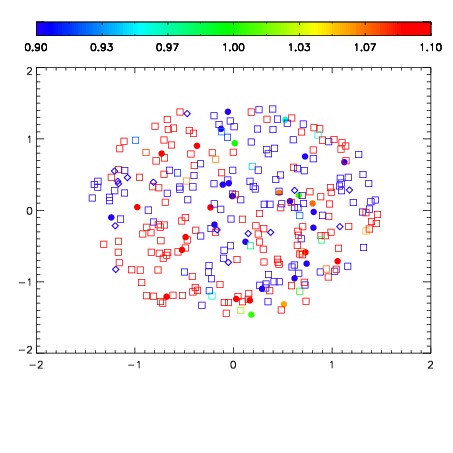
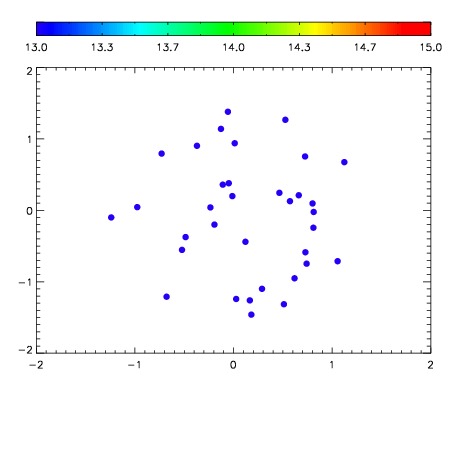

| Frame | Nreads | Zeropoints | Mag plots | Spatial mag deviation | Spatial sky 16325A emission deviations (filled: sky, open: star) | Spatial sky continuum emission | Spatial sky telluric CO2 absorption deviations (filled: H < 10) | |||||||||||||||||||||||
| 0 | 0 |
|
|
|
|
|
|
| IPAIR | NAME | SHIFT | NEWSHIFT | S/N | NAME | SHIFT | NEWSHIFT | S/N |
| 0 | 19310028 | 0.493104 | 0.00000 | 19.0787 | 19310025 | 0.00165031 | 0.491454 | 19.0903 |
| 1 | 19310024 | 0.491582 | 0.00152200 | 19.0498 | 19310022 | 0.00000 | 0.493104 | 19.0669 |
| 2 | 19310027 | 0.492797 | 0.000307024 | 19.0410 | 19310029 | 0.00224921 | 0.490855 | 19.0586 |
| 3 | 19310023 | 0.491207 | 0.00189701 | 19.0232 | 19310026 | 0.00172648 | 0.491378 | 19.0204 |