| Red | Green | Blue | |
| z | 17.64 | ||
| znorm | Inf | ||
| sky | -Inf | -Inf | -Inf |
| S/N | 27.5 | 41.3 | 52.3 |
| S/N(c) | 37.9 | 69.8 | 68.0 |
| SN(E/C) |
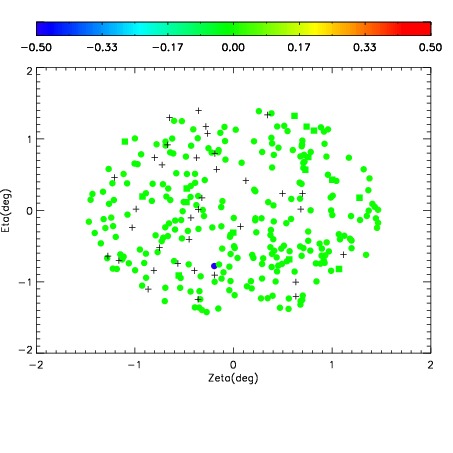
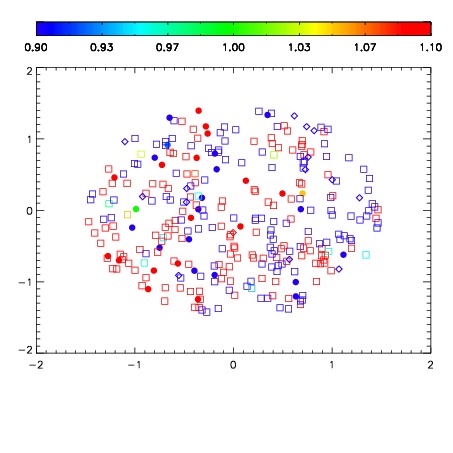
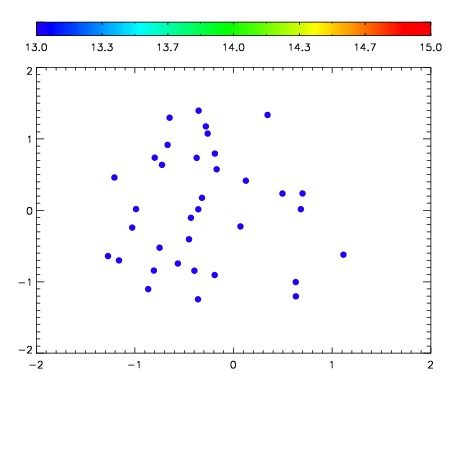

| Frame | Nreads | Zeropoints | Mag plots | Spatial mag deviation | Spatial sky 16325A emission deviations (filled: sky, open: star) | Spatial sky continuum emission | Spatial sky telluric CO2 absorption deviations (filled: H < 10) | |||||||||||||||||||||||
| 0 | 0 |
|
|
|
|
|
|
| IPAIR | NAME | SHIFT | NEWSHIFT | S/N | NAME | SHIFT | NEWSHIFT | S/N |
| 0 | 18550051 | 0.493906 | 0.00000 | 18.8536 | 18550052 | 0.000621057 | 0.493285 | 18.8721 |
| 1 | 18550054 | 0.491921 | 0.00198498 | 18.9322 | 18550053 | 0.000188370 | 0.493718 | 18.9923 |
| 2 | 18550050 | 0.493274 | 0.000631988 | 18.8467 | 18550049 | 0.00000 | 0.493906 | 18.8442 |
| 3 | 18550055 | 0.491705 | 0.00220099 | 18.6491 | 18550056 | 0.00183479 | 0.492071 | 18.7724 |