| Red | Green | Blue | |
| z | 17.64 | ||
| znorm | Inf | ||
| sky | -Inf | -Inf | -Inf |
| S/N | 31.3 | 48.5 | 59.0 |
| S/N(c) | 30.9 | 22.4 | 38.9 |
| SN(E/C) |
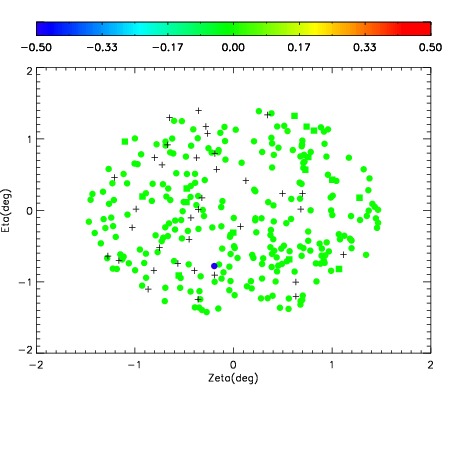
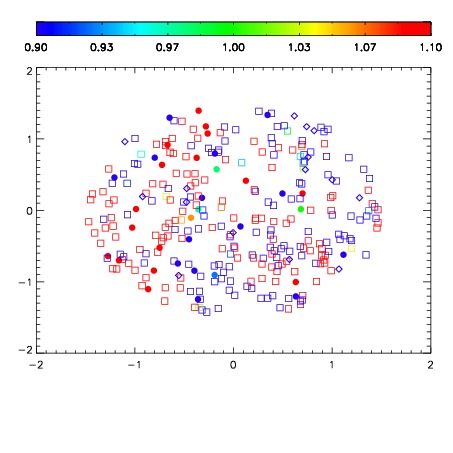
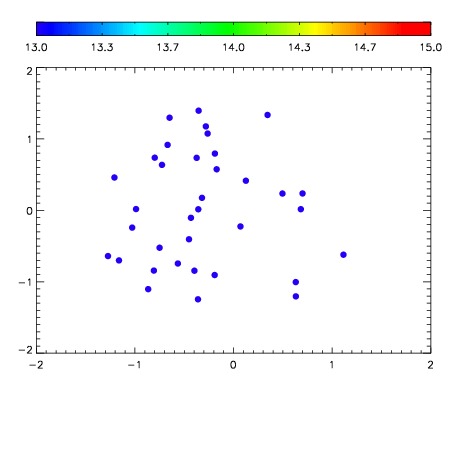

| Frame | Nreads | Zeropoints | Mag plots | Spatial mag deviation | Spatial sky 16325A emission deviations (filled: sky, open: star) | Spatial sky continuum emission | Spatial sky telluric CO2 absorption deviations (filled: H < 10) | |||||||||||||||||||||||
| 0 | 0 |
|
|
|
|
|
|
| IPAIR | NAME | SHIFT | NEWSHIFT | S/N | NAME | SHIFT | NEWSHIFT | S/N |
| 0 | 18780081 | 0.507386 | 0.00000 | 18.8569 | 18780079 | 0.00179901 | 0.505587 | 18.8529 |
| 1 | 18780080 | 0.506695 | 0.000691056 | 18.9269 | 18780082 | 0.00152729 | 0.505859 | 19.0373 |
| 2 | 18780077 | 0.507120 | 0.000266016 | 18.7903 | 18780078 | 0.00156691 | 0.505819 | 18.7968 |
| 3 | 18780076 | 0.507181 | 0.000205040 | 18.7585 | 18780075 | 0.00000 | 0.507386 | 18.7292 |