| Red | Green | Blue | |
| z | 17.65 | ||
| znorm | Inf | ||
| sky | -Inf | -Inf | -Inf |
| S/N | 23.3 | 35.6 | 44.6 |
| S/N(c) | 25.3 | 45.5 | 68.5 |
| SN(E/C) |
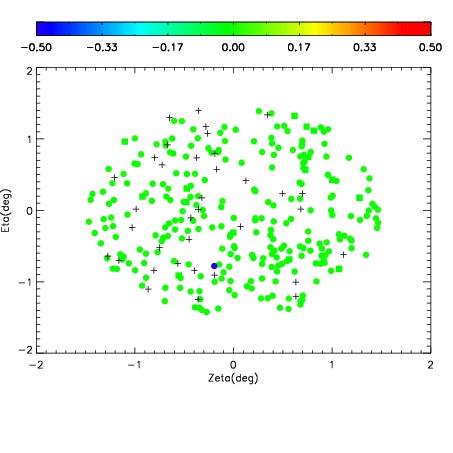
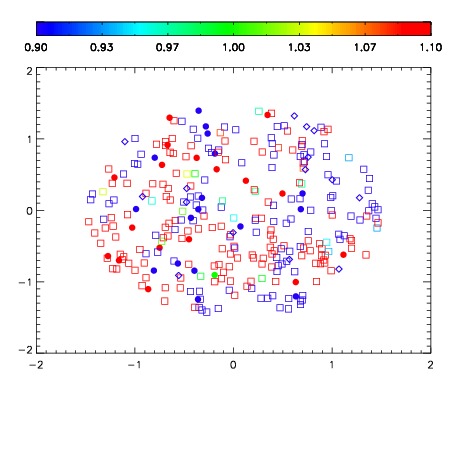
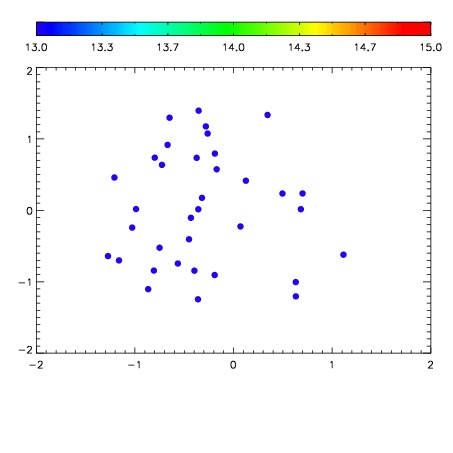

| Frame | Nreads | Zeropoints | Mag plots | Spatial mag deviation | Spatial sky 16325A emission deviations (filled: sky, open: star) | Spatial sky continuum emission | Spatial sky telluric CO2 absorption deviations (filled: H < 10) | |||||||||||||||||||||||
| 0 | 0 |
|
|
|
|
|
|
| IPAIR | NAME | SHIFT | NEWSHIFT | S/N | NAME | SHIFT | NEWSHIFT | S/N |
| 0 | 18870057 | 0.00329456 | 0.00000 | 16.1857 | 18870054 | -0.509545 | 0.512840 | 17.8687 |
| 1 | 18870053 | 0.00000 | 0.00329456 | 19.1163 | 18870059 | -0.507973 | 0.511268 | 19.1316 |
| 2 | 18870060 | 0.000341711 | 0.00295285 | 19.0715 | 18870058 | -0.507824 | 0.511119 | 18.4990 |
| 3 | 18870056 | 0.00189083 | 0.00140373 | 15.2760 | 18870055 | -0.509449 | 0.512744 | 17.1348 |