| Red | Green | Blue | |
| z | 17.64 | ||
| znorm | Inf | ||
| sky | -Inf | -Inf | -NaN |
| S/N | 32.6 | 50.3 | 61.1 |
| S/N(c) | 33.3 | 63.4 | 42.6 |
| SN(E/C) |
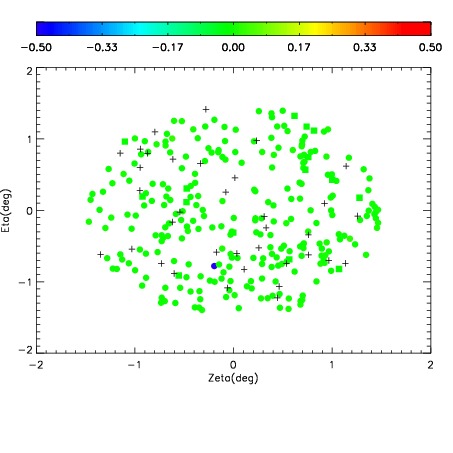
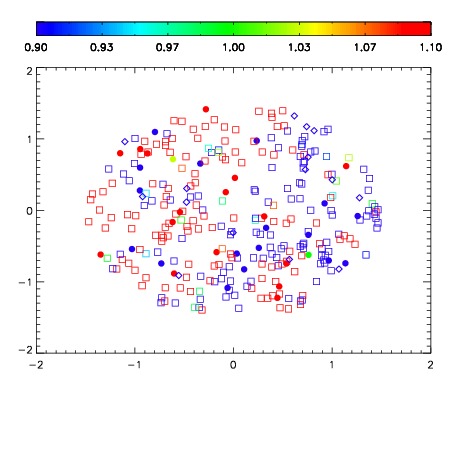
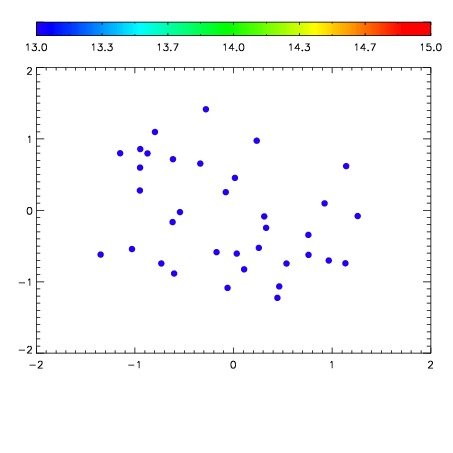

| Frame | Nreads | Zeropoints | Mag plots | Spatial mag deviation | Spatial sky 16325A emission deviations (filled: sky, open: star) | Spatial sky continuum emission | Spatial sky telluric CO2 absorption deviations (filled: H < 10) | |||||||||||||||||||||||
| 0 | 0 |
|
|
|
|
|
|
| IPAIR | NAME | SHIFT | NEWSHIFT | S/N | NAME | SHIFT | NEWSHIFT | S/N |
| 0 | 19140058 | 0.00137272 | 0.00000 | 19.0200 | 19140056 | -0.501972 | 0.503345 | 18.9702 |
| 1 | 19140061 | -0.000795852 | 0.00216857 | 19.0746 | 19140059 | -0.501029 | 0.502402 | 19.0425 |
| 2 | 19140054 | 0.00000 | 0.00137272 | 19.0343 | 19140060 | -0.500918 | 0.502291 | 19.0080 |
| 3 | 19140057 | 0.00120059 | 0.000172130 | 19.0302 | 19140055 | -0.502353 | 0.503726 | 19.0076 |