| Red | Green | Blue | |
| z | 17.64 | ||
| znorm | Inf | ||
| sky | -Inf | -Inf | -NaN |
| S/N | 26.6 | 39.8 | 50.2 |
| S/N(c) | 20.6 | 49.8 | 22.7 |
| SN(E/C) |
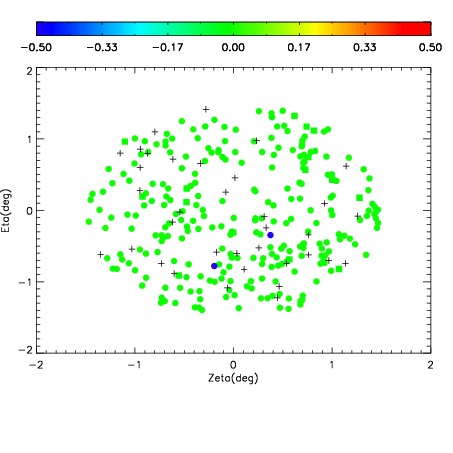
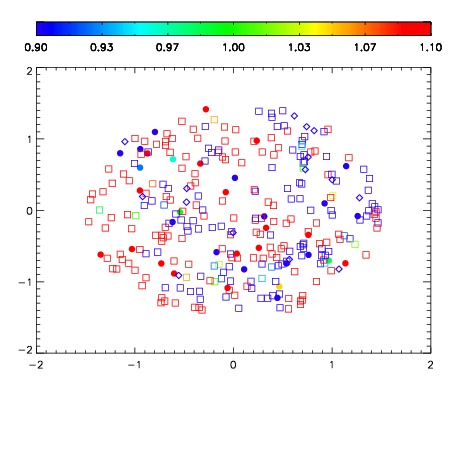
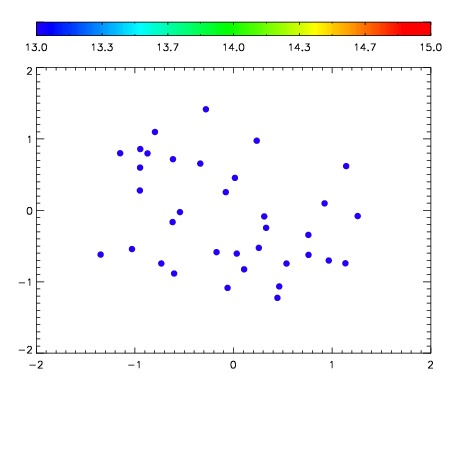

| Frame | Nreads | Zeropoints | Mag plots | Spatial mag deviation | Spatial sky 16325A emission deviations (filled: sky, open: star) | Spatial sky continuum emission | Spatial sky telluric CO2 absorption deviations (filled: H < 10) | |||||||||||||||||||||||
| 0 | 0 |
|
|
|
|
|
|
| IPAIR | NAME | SHIFT | NEWSHIFT | S/N | NAME | SHIFT | NEWSHIFT | S/N |
| 0 | 19350031 | 0.488592 | 0.00000 | 19.0410 | 19350033 | 0.000591711 | 0.488000 | 19.0544 |
| 1 | 19350030 | 0.488353 | 0.000238985 | 19.0420 | 19350032 | 0.00101617 | 0.487576 | 19.0553 |
| 2 | 19350034 | 0.488590 | 1.99676e-06 | 19.0138 | 19350029 | 0.00000 | 0.488592 | 18.9922 |