| Red | Green | Blue | |
| z | 17.64 | ||
| znorm | Inf | ||
| sky | -Inf | -Inf | -Inf |
| S/N | 32.5 | 48.2 | 61.1 |
| S/N(c) | 24.3 | 58.8 | 27.0 |
| SN(E/C) |
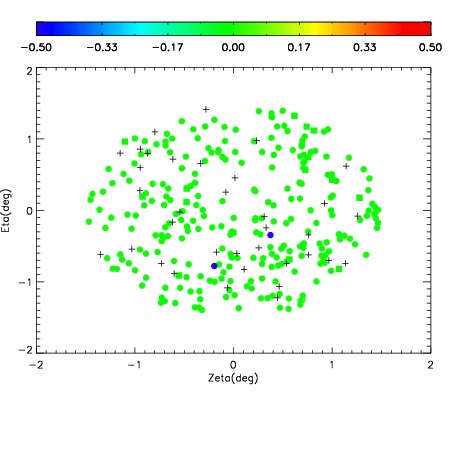
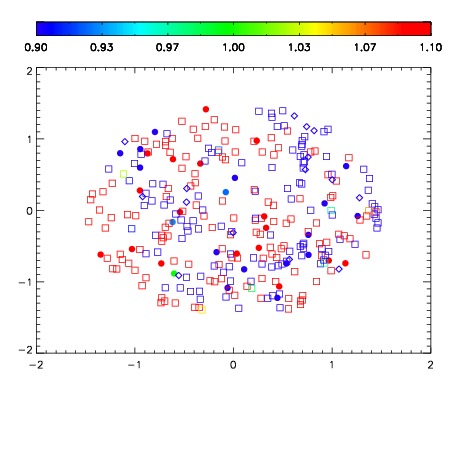
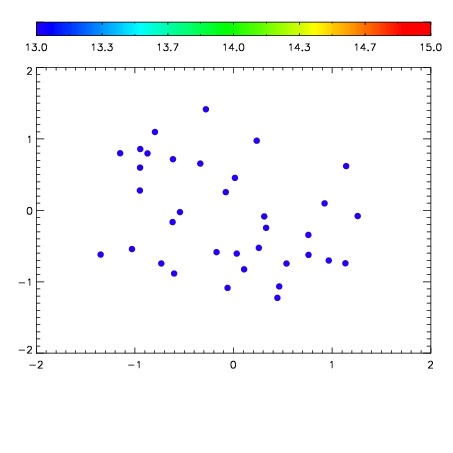

| Frame | Nreads | Zeropoints | Mag plots | Spatial mag deviation | Spatial sky 16325A emission deviations (filled: sky, open: star) | Spatial sky continuum emission | Spatial sky telluric CO2 absorption deviations (filled: H < 10) | |||||||||||||||||||||||
| 0 | 0 |
|
|
|
|
|
|
| IPAIR | NAME | SHIFT | NEWSHIFT | S/N | NAME | SHIFT | NEWSHIFT | S/N |
| 0 | 19360052 | 0.00222503 | 0.00000 | 19.0969 | 19360050 | -0.480859 | 0.483084 | 19.1368 |
| 1 | 19360049 | -0.000365782 | 0.00259081 | 19.1363 | 19360051 | -0.481264 | 0.483489 | 19.1532 |
| 2 | 19360048 | -0.00102535 | 0.00325038 | 19.0991 | 19360046 | -0.488257 | 0.490482 | 19.1473 |
| 3 | 19360045 | 0.00000 | 0.00222503 | 19.0941 | 19360047 | -0.488033 | 0.490258 | 19.1364 |