| Red | Green | Blue | |
| z | 17.64 | ||
| znorm | Inf | ||
| sky | -Inf | -Inf | -Inf |
| S/N | 28.6 | 42.4 | 51.0 |
| S/N(c) | 34.1 | 54.3 | 25.8 |
| SN(E/C) |

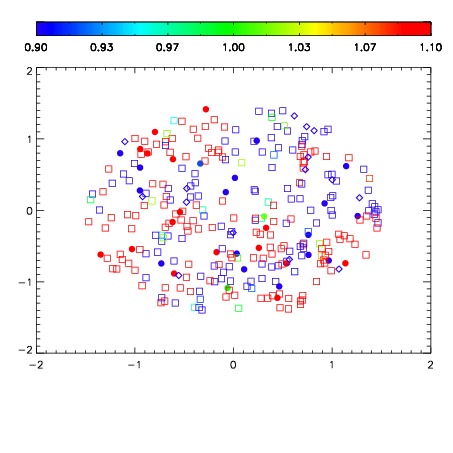
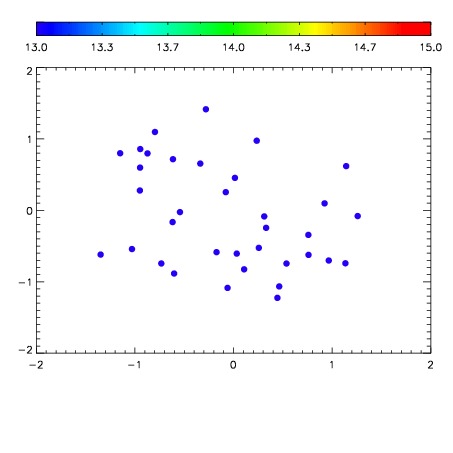

| Frame | Nreads | Zeropoints | Mag plots | Spatial mag deviation | Spatial sky 16325A emission deviations (filled: sky, open: star) | Spatial sky continuum emission | Spatial sky telluric CO2 absorption deviations (filled: H < 10) | |||||||||||||||||||||||
| 0 | 0 |
|
|
|
|
|
|
| IPAIR | NAME | SHIFT | NEWSHIFT | S/N | NAME | SHIFT | NEWSHIFT | S/N |
| 0 | 19620035 | 0.496876 | 0.00000 | 18.7825 | 19620033 | 0.000949899 | 0.495926 | 18.7955 |
| 1 | 19620034 | 0.496840 | 3.60012e-05 | 18.8025 | 19620036 | 0.00301626 | 0.493860 | 18.8315 |
| 2 | 19620031 | 0.496460 | 0.000416011 | 18.6926 | 19620032 | 0.00121082 | 0.495665 | 18.6975 |
| 3 | 19620030 | 0.495450 | 0.00142601 | 18.6743 | 19620029 | 0.00000 | 0.496876 | 18.6870 |