| Red | Green | Blue | |
| z | 17.64 | ||
| znorm | Inf | ||
| sky | -Inf | -Inf | -NaN |
| S/N | 35.2 | 51.3 | 62.4 |
| S/N(c) | 0.4 | 60.6 | 40.9 |
| SN(E/C) |
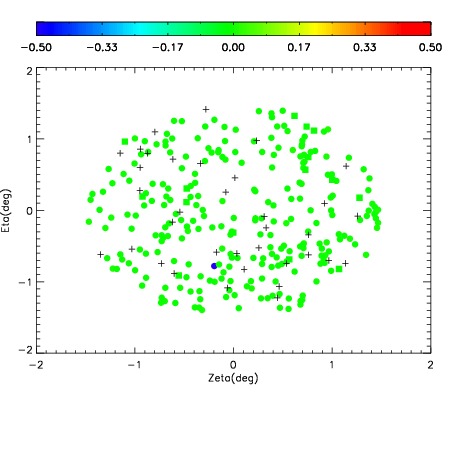
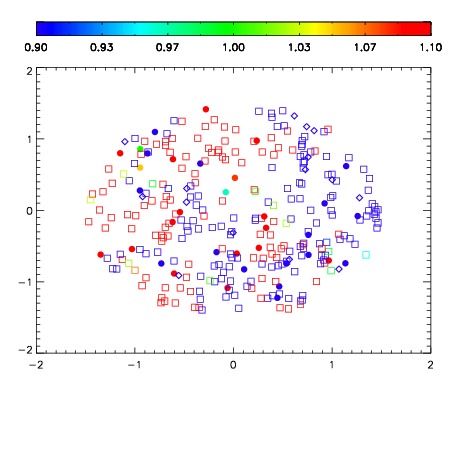
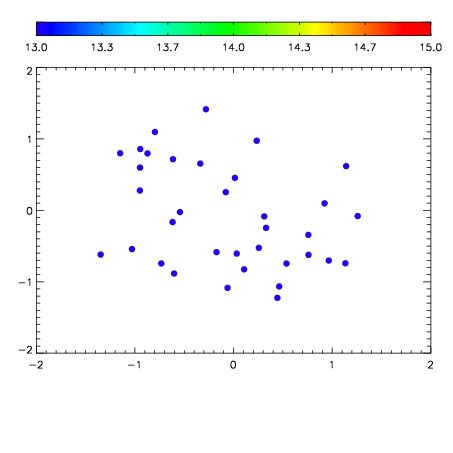

| Frame | Nreads | Zeropoints | Mag plots | Spatial mag deviation | Spatial sky 16325A emission deviations (filled: sky, open: star) | Spatial sky continuum emission | Spatial sky telluric CO2 absorption deviations (filled: H < 10) | |||||||||||||||||||||||
| 0 | 0 |
|
|
|
|
|
|
| IPAIR | NAME | SHIFT | NEWSHIFT | S/N | NAME | SHIFT | NEWSHIFT | S/N |
| 0 | 19670031 | 0.501340 | 0.00000 | 19.1581 | 19670029 | 0.00343983 | 0.497900 | 19.1706 |
| 1 | 19670030 | 0.500605 | 0.000734985 | 19.1751 | 19670032 | 0.00533352 | 0.496006 | 19.1839 |
| 2 | 19670027 | 0.499520 | 0.00181997 | 19.0871 | 19670028 | 0.00307015 | 0.498270 | 19.1398 |
| 3 | 19670026 | 0.498543 | 0.00279698 | 18.7586 | 19670025 | 0.00000 | 0.501340 | 19.0072 |