| Red | Green | Blue | |
| z | 17.65 | ||
| znorm | Inf | ||
| sky | -Inf | -Inf | -Inf |
| S/N | 10.6 | 17.2 | 21.2 |
| S/N(c) | 12.9 | 11.5 | 19.2 |
| SN(E/C) |
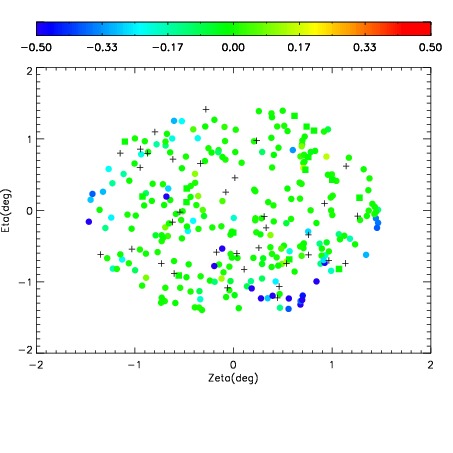


| Frame | Nreads | Zeropoints | Mag plots | Spatial mag deviation | Spatial sky 16325A emission deviations (filled: sky, open: star) | Spatial sky continuum emission | Spatial sky telluric CO2 absorption deviations (filled: H < 10) | |||||||||||||||||||||||
| 0 | 0 |
|
|
|
|
|
|
| IPAIR | NAME | SHIFT | NEWSHIFT | S/N | NAME | SHIFT | NEWSHIFT | S/N |
| 0 | 19690028 | 0.494610 | 0.00000 | 17.3411 | 19690029 | -0.000898294 | 0.495508 | 16.4788 |
| 1 | 19690027 | 0.494108 | 0.000502020 | 18.3266 | 19690026 | 0.00000 | 0.494610 | 18.1577 |