| Red | Green | Blue | |
| z | 17.64 | ||
| znorm | Inf | ||
| sky | -Inf | -Inf | -Inf |
| S/N | 36.3 | 56.9 | 63.6 |
| S/N(c) | 34.4 | 26.3 | 108.4 |
| SN(E/C) |
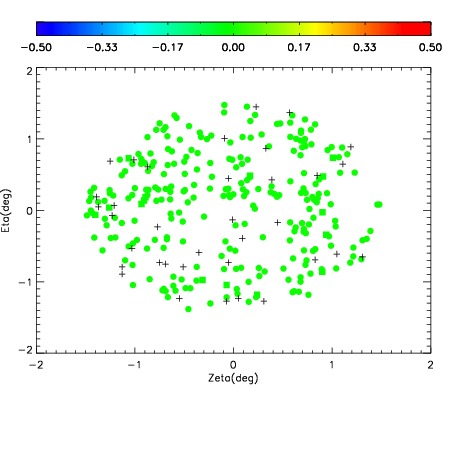
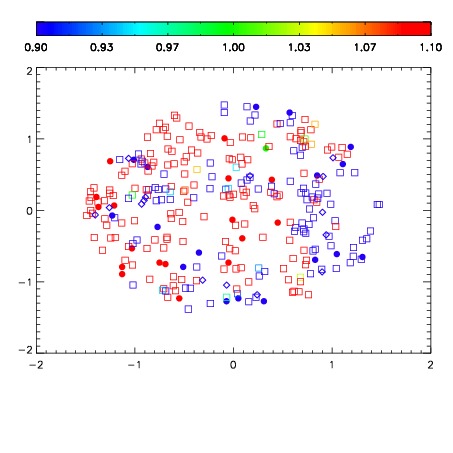
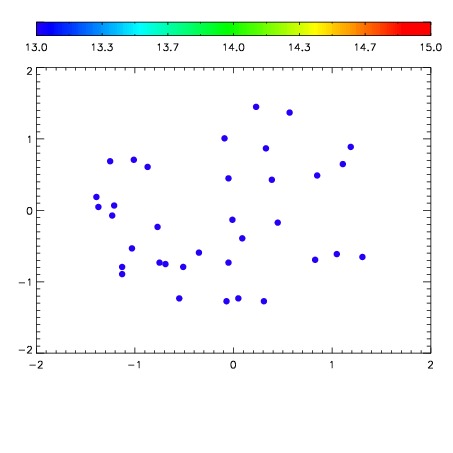

| Frame | Nreads | Zeropoints | Mag plots | Spatial mag deviation | Spatial sky 16325A emission deviations (filled: sky, open: star) | Spatial sky continuum emission | Spatial sky telluric CO2 absorption deviations (filled: H < 10) | |||||||||||||||||||||||
| 0 | 0 |
|
|
|
|
|
|
| IPAIR | NAME | SHIFT | NEWSHIFT | S/N | NAME | SHIFT | NEWSHIFT | S/N |
| 0 | 18760043 | 0.504712 | 0.00000 | 19.0423 | 18760037 | 0.00000 | 0.504712 | 19.0528 |
| 1 | 18760038 | 0.503948 | 0.000764012 | 19.1135 | 18760044 | 0.00272225 | 0.501990 | 19.0824 |
| 2 | 18760039 | 0.504452 | 0.000259995 | 19.1087 | 18760040 | -0.000113836 | 0.504826 | 19.0669 |
| 3 | 18760042 | 0.502948 | 0.00176400 | 19.0247 | 18760041 | -0.000110052 | 0.504822 | 19.0337 |