| Red | Green | Blue | |
| z | 17.64 | ||
| znorm | Inf | ||
| sky | -Inf | -Inf | -Inf |
| S/N | 29.5 | 48.5 | 58.1 |
| S/N(c) | 35.1 | 24.5 | 110.7 |
| SN(E/C) |
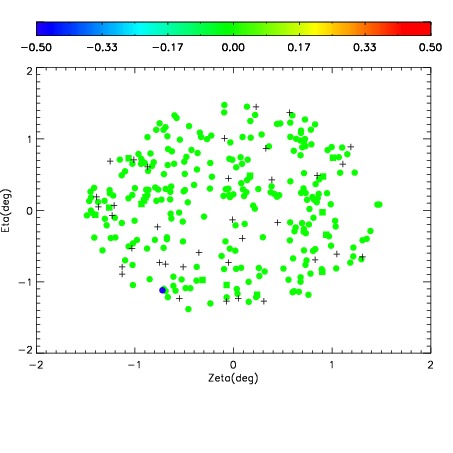
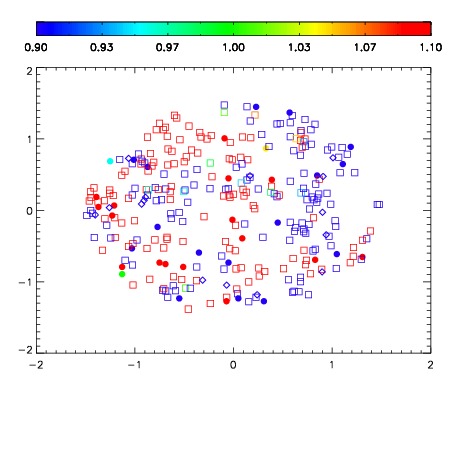
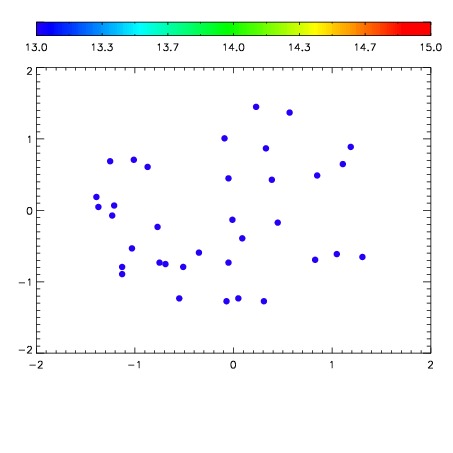

| Frame | Nreads | Zeropoints | Mag plots | Spatial mag deviation | Spatial sky 16325A emission deviations (filled: sky, open: star) | Spatial sky continuum emission | Spatial sky telluric CO2 absorption deviations (filled: H < 10) | |||||||||||||||||||||||
| 0 | 0 |
|
|
|
|
|
|
| IPAIR | NAME | SHIFT | NEWSHIFT | S/N | NAME | SHIFT | NEWSHIFT | S/N |
| 0 | 18840062 | 0.00000 | 0.00000 | 19.0042 | 18840067 | -0.516223 | 0.516223 | 18.9826 |
| 1 | 18840066 | -0.00107662 | 0.00107662 | 19.0317 | 18840064 | -0.519197 | 0.519197 | 19.0695 |
| 2 | 18840065 | -0.00189342 | 0.00189342 | 19.0280 | 18840063 | -0.518110 | 0.518110 | 19.0397 |
| 3 | 18840069 | -0.00461684 | 0.00461684 | 19.0279 | 18840068 | -0.516383 | 0.516383 | 18.9973 |