| Red | Green | Blue | |
| z | 17.65 | ||
| znorm | Inf | ||
| sky | -Inf | -Inf | -Inf |
| S/N | 19.0 | 28.8 | 34.3 |
| S/N(c) | 22.3 | 0.4 | 16.0 |
| SN(E/C) |
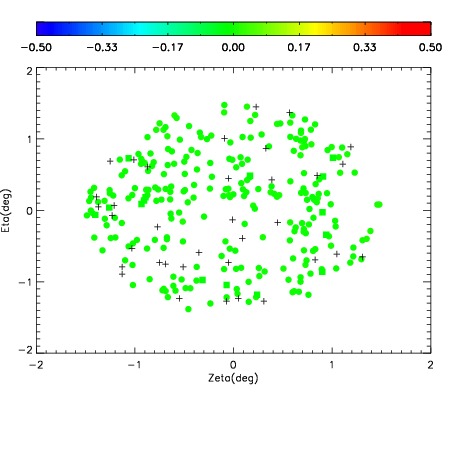
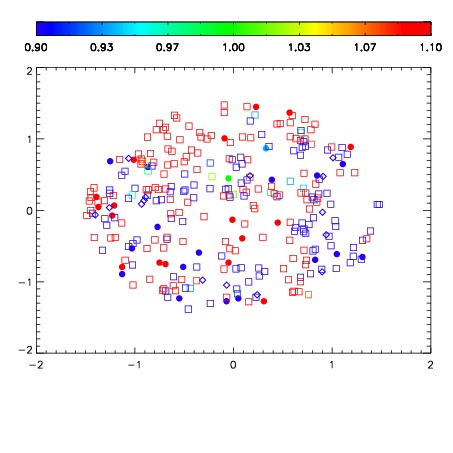
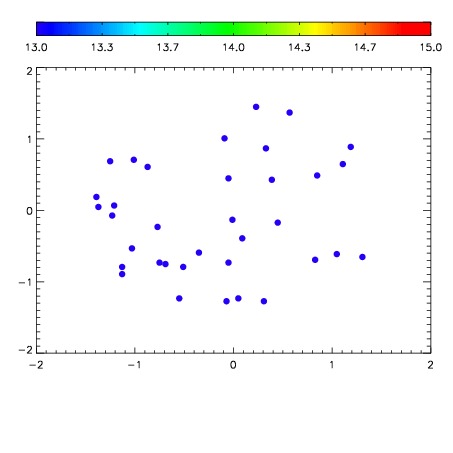

| Frame | Nreads | Zeropoints | Mag plots | Spatial mag deviation | Spatial sky 16325A emission deviations (filled: sky, open: star) | Spatial sky continuum emission | Spatial sky telluric CO2 absorption deviations (filled: H < 10) | |||||||||||||||||||||||
| 0 | 0 |
|
|
|
|
|
|
| IPAIR | NAME | SHIFT | NEWSHIFT | S/N | NAME | SHIFT | NEWSHIFT | S/N |
| 0 | 19070042 | 0.501471 | 0.00000 | 18.9322 | 19070043 | 0.000452739 | 0.501018 | 19.0916 |
| 1 | 19070041 | 0.500690 | 0.000781000 | 18.4966 | 19070040 | 0.00000 | 0.501471 | 18.8867 |